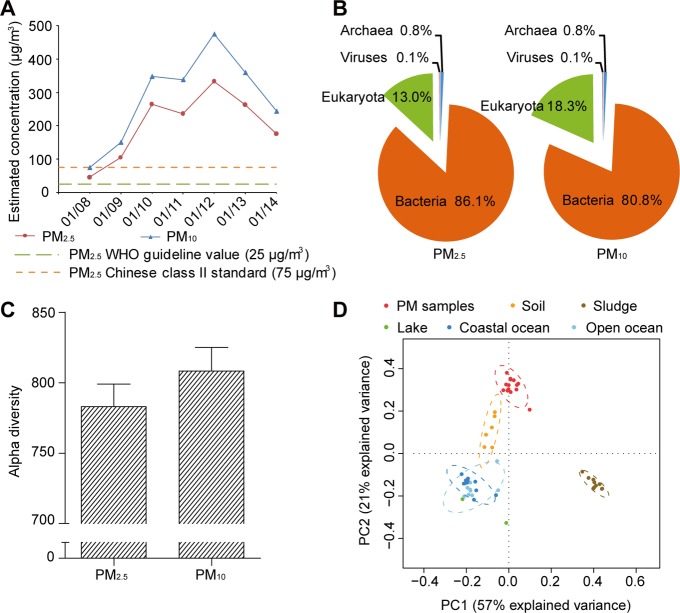
Figure 1.
Characteristics of the collected PM samples and sequenced metagenomes. (A) Daily average PM2.5 and PM10 concentrations estimated from the collected samples during January 8–14, 2013. (B) Relative abundance of the MG-RAST taxonomic hits at the domain level in PM2.5 and PM10 samples. (C) Estimated average alpha diversity of the PM2.5 and PM10 samples (error bars represent SD of the 7 daily PM2.5 and 7 PM10 samples, respectively). (D) Principal component analysis of the relative abundance of microorganisms at the phylum level of the 14 sequenced PM metagenomes (red) compared to those of other environments (other colors).

