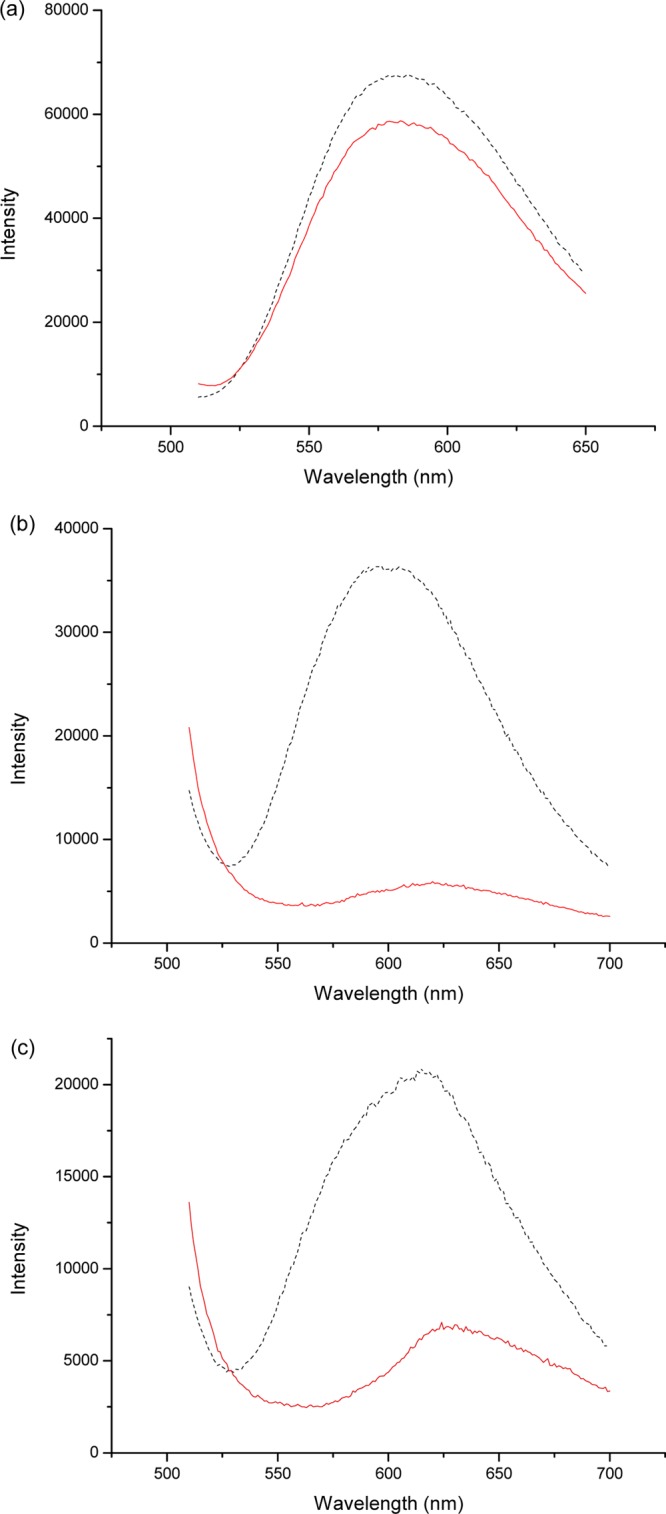
Figure 8.

Displacement of ARS from APBA-PA by fructose in (a) 0.1 M acetate buffer, pH 4.6; (b) 0.1 M PBS, pH 7.4; (c) and 0.1 M PBS, pH 9.0. The dotted line represents the fluorescence of a solution containing 0.1 mM ARS and 0.1 mM APBA-PA at the given pH. The solid line represents the fluorescence of the same solution after addition of fructose powder (final concentration 100 mM).
