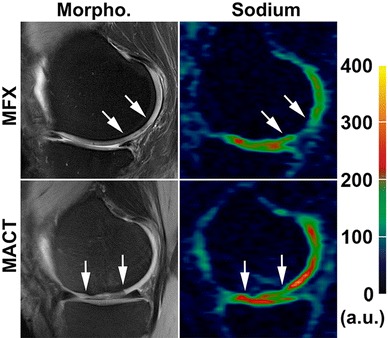
Fig. 3.

Proton density-weighted MR images with fat suppression (left column) and color-coded sodium 3D-GRE images (right column) from a patient after MFX treatment (upper row) and a subject after MACT surgery (lower row). The area of cartilage repair tissue is located between the arrows. Color scale represents the sodium signal intensity values
