
Fig. 4.
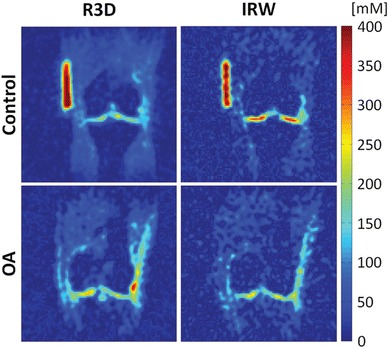
Sodium concentration maps from a control subject (upper row) and from a patient with OA (lower row). Sodium images were acquired with fluid suppression using IR (IRW) and without fluid suppression (R3D). Note that the difference in cartilage sodium concentration between the control and OA patient is higher with the fluid-suppressed radial sequence than with the radial sequence without fluid suppression. From [85••], with permission