
Figure 5.
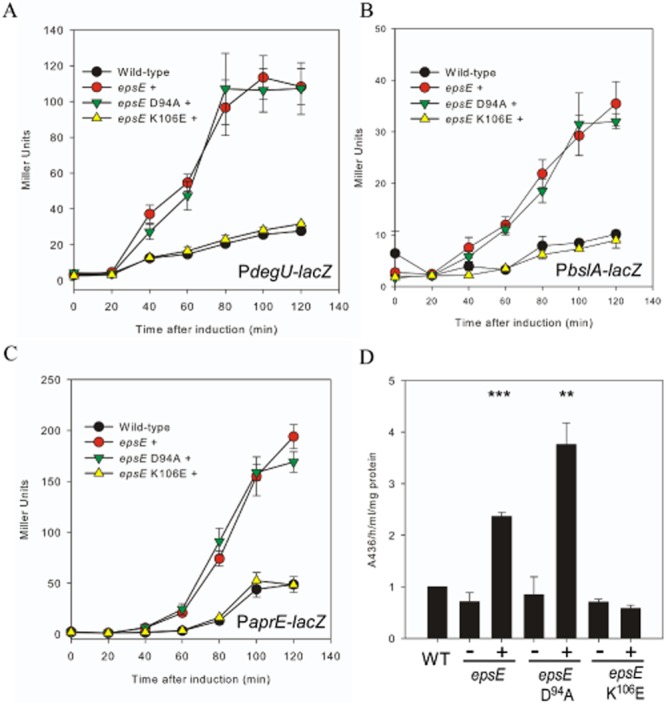
Engaging the flagellar clutch causes an increase in DegU∼P levels.A–C. β-Galactosidase assays of strains carrying the (A) PdegU–lacZ, (B) PbslA–lacZ or (C) PaprE–lacZ transcriptional reporter fusion. Cells were grown to 0.5 OD600 and induced with 1 mM IPTG (final concentration). Strains shown are: (A) wild-type (NRS4351), epsE + (PIPTG-epsE-lacI (NRS4374)), epsE D94A + (PIPTG-epsE-D94A-lacI (NRS4392)) and epsE K106E (PIPTG-epsE-K106E-lacI (NRS4394)); (B) Wild-type (NRS2052), PIPTG-epsE-lacI (NRS4405), PIPTG-epsE-D94A-lacI (NRS4406) and PIPTG-epsE-K106E-lacI (NRS4407); (C) Wild-type (NRS1561), PIPTG-epsE-lacI (NRS4345), PIPTG-epsE-D94A-lacI (NRS4393) and PIPTG-epsE-K106E-lacI (NRS4395). Data shown in (A), (B) and (C) are plotted as the average of at least three independent replicates. Error bars represent standard error of the mean.D. Total protease activity assays performed with supernatants collected from cells grown in (C) after 120 min of induction in the absence or presence of 1 mM IPTG. Data are plotted as the average of at least three independent replicates and are represented as a fold change relative to the wild-type strain (WT) which was assigned value of 1. Error bars represent standard error of the mean. An asterisk denotes significance as calculated by the Student's t-test, where ** represents P < 0.01; and *** P < 0.001.