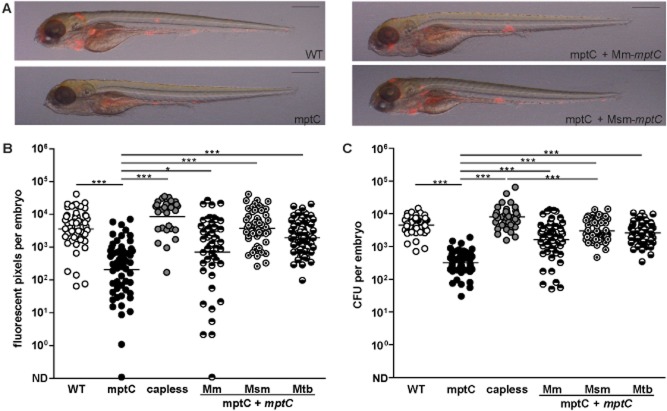
Figure 1.
Transposon mutant in mmar_3225 attenuated for granuloma formation in zebrafish embryo model.A. Representative overlays of brightfield and fluorescent images of embryos at 5 dpi with wildtype M. marinum (WT), mptC mutant (mptC), mptC mutant complemented with M. marinum mptC (mptC + mptC Mm) and mptC mutant complemented with M. smegmatis mptC (mptC + mptC Msm). Inocula were 117, 158, 138, and 198 cfu respectively. Scale bars represent 500 μm.B and C. Quantification of embryo infection at 5 dpi with wildtype M. marinum, the mptC mutant, the capless mutant (capless), the mptC mutant complemented with M. marinum mptC, the mptC mutant complemented with M. smegmatis mptC and the mptC mutant complemented with M. tuberculosis mptC (mptC + mptC Mtb). (B) Number of red pixels in fluorescent images of infected embryos as determined with custom-designed software and (C) number of cfu of single infected embryos as determined by whole-embryo plating. Both graphs show data of three independent experiments and the bars represent mean after log transformation. Mean ± standard deviation of inocula were 99 ± 6, 149 ± 9, 99 ± 6, 134 ± 18, 144 ± 21 and 104 ± 13 cfu respectively. *P < 0.05, ***P < 0.0001, one-way anova, Bonferroni's multiple comparison test on log transformed data. ND, not detected.

