Figure 5.

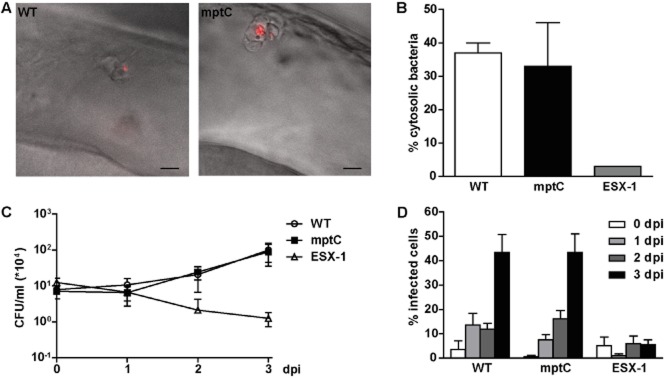
Initial survival of mptC mutant in macrophages not affected.A. Overlay of differential interference contrast and fluorescent images of lateral view of the hindbrain ventricle of embryos at 4 h post infection with wildtype M. marinum (WT) or the mptC mutant (mptC). Highly activated macrophages on the roof of the ventricle have engulfed the bacteria. Scale bars represent 10 μm.B. Translocation of wildtype M. marinum, the mptC mutant and the ESX-1 deficient eccCb1::tn mutant (ESX-1) in THP-1 macrophage-like cells. Cells were infected for 24 h at MOI 10 and the percentage of cytosolic bacteria was determined by electron microscope analysis. Data shown for wildtype and mptC mutant represent mean + SEM of two independent experiments, 465 individual bacteria in infected THP-1 were counted. For the eccCb1::tn mutant one sample was analysed.C. Intracellular growth of wildtype M. marinum, the mptC mutant and the eccCb1::tn mutant in THP-1 cells. Infections were performed at MOI 0.5 and colony forming units were determined by lysing infected cells and plating lysates at indicated timepoints. The graph represents mean ± SEM of three independent replicates.D. Intercellular spread of wildtype M. marinum, the mptC mutant and the eccCb1::tn mutant. THP-1 cells were infected at MOI 0.5 and the percentage of infected cells was determined by microscopic enumeration of infected cells. Three representative microscopic fields with each ∼ 50–250 THP-1 cells were counted per experiment. Mean + SEM of three independent experiments is shown.
