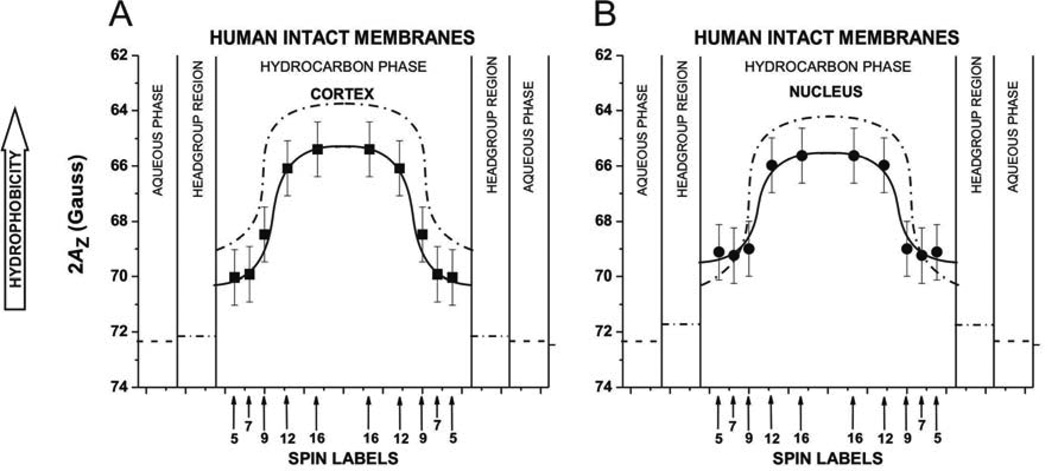
Fig. 7.
Profiles of hydrophobicity (2AZ) obtained with n-SASLs for (A) cortical and (B) nuclear intact membranes. Profiles represent averaged values from bulk, boundary, and trapped lipids. 2AZ (mean values and standard deviations) obtained with 12-SASL from three different preparations of membranes from eyes of three different donors are 65.24 ±0.73 G for cortical membranes and are 65 ±0.80 G for nuclear membranes. Superimposed are profiles for cortical (A) and nuclear (B) lens lipid membranes (broken lines drawn based on data presented in (Mainali et al., 2013b)). Approximate localizations of the nitroxide moieties of spin labels are indicated by arrows.

