Figure 3.

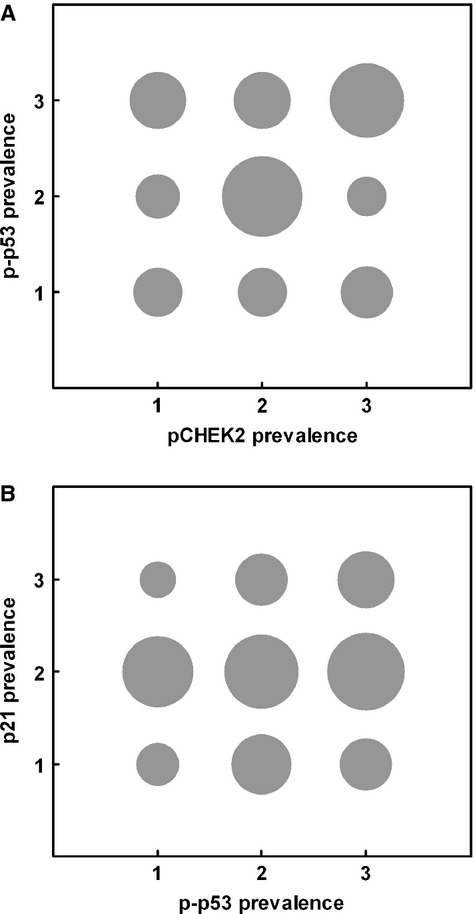
Lack of relation between prevalence of p-p53 and those of pCHEK2 and p21. Grouped scatter plots, all categories of lesions pooled. The area of each circle is proportional to the number of lesions in that class for each marker. (A) pCHEK2 and p-p53; (B) p-p53 and p21. For pCHEK2 and p-p53, prevalence classes 1, 2, and 3 here are as in Figure 1 (<5, 5–50, and >50% positive cells), while classes 1, 2, and 3 for p21 were chosen to span the lower levels of expression seen, namely 0, >0–10, and >10% positive cells. No correlation was found in either case: Spearman rank correlation coefficient r = −0.19 for (a) and 0.06 for (B) (NS).
