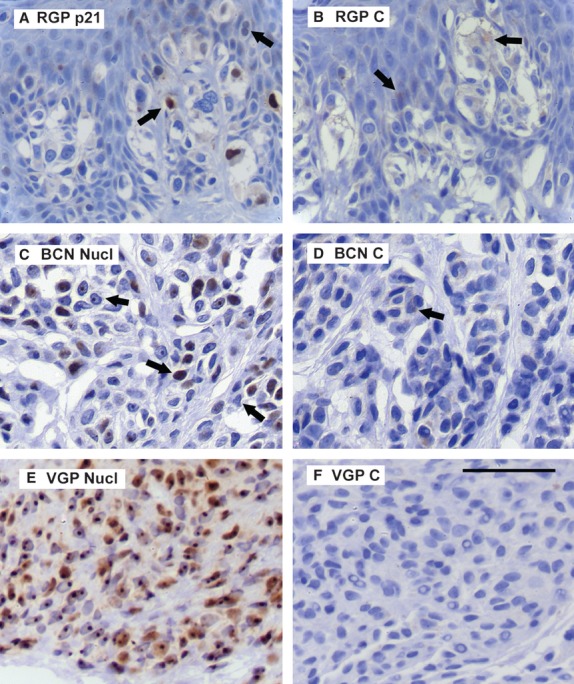
Figure 4.

Expression patterns for p21 and nucleolin. Key: C, control section of same lesion; Nucl, nucleolin. Figure S3 shows the RGB blue channel for all of these panels. Scale bar for all panels: 50 μm. (A) Typical p21 reaction in an RGP (MIV) melanoma. Positive (nuclear) stain in a few melanoma cells, sometimes weak (right arrow, clearer in blue channel), while many cells were negative. Cytoplasmic brown here was melanin, as seen in control section (B) (compare also Figure S3). No p21 was detected in normal tissues. (C) Nucleolin in a BCN. Reaction was typically nucleolar (left arrow), while sometimes pan-nuclear or absent (middle and right arrows). Control section (D) showed traces of cytoplasmic brown melanin (arrow). (E) Nucleolin in a VGP melanoma. Nearly all cells had strong reaction in the nucleolus and weaker nucleoplasmic expression. The cytoplasmic color was not melanin, as this melanoma had little or no melanin (F).
