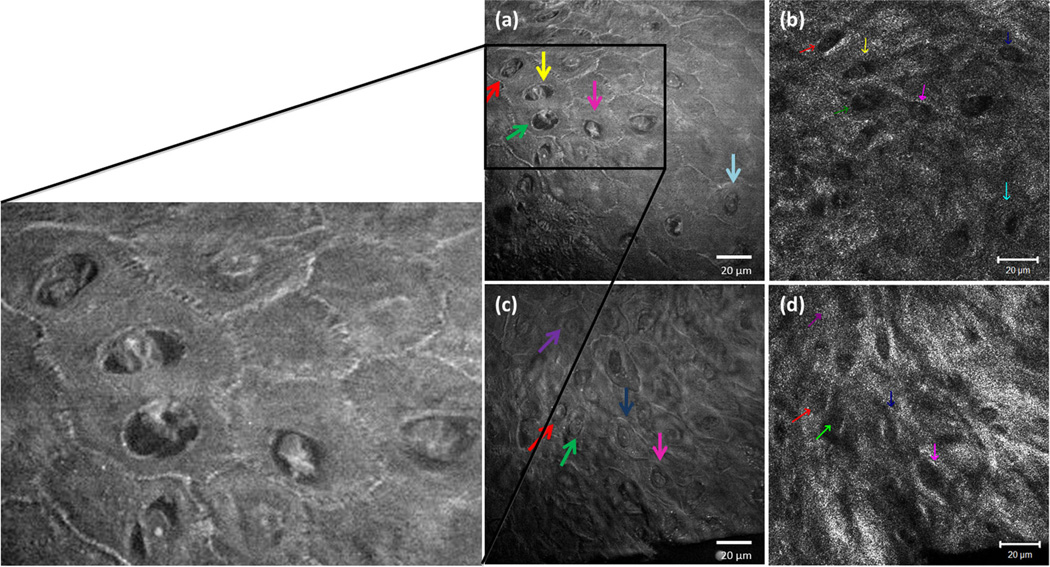
Fig. 2.
Simultaneous comparison of SRS and RCM in SCC tumor. (a, c) SRS signal from keratinocytes imaged using 60X, 1.2 NA water objective, and simultaneously compared with the (b, d) respective confocal reflectance signal using 63X, 1.2 NA Apochromat water objective. On the left shows a magnified SRS image with enhanced cellular signal. The color coded arrows correspond to the same cells compared in both the techniques.

