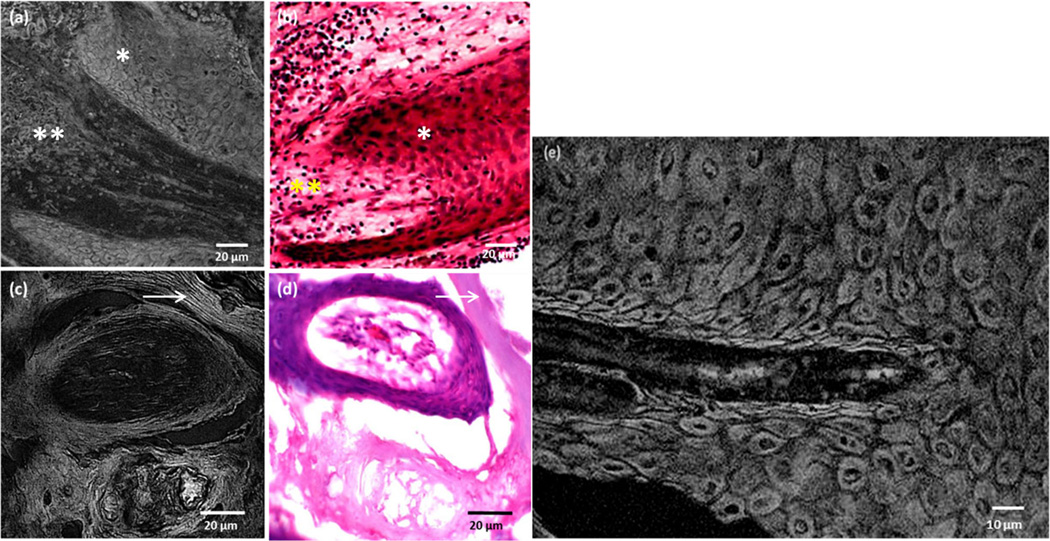
Fig. 5.
Superficial SCC features as seen in SRS images in comparison with H&E image. a, b: Epidermal keratinocytes surrounding the dermis and (c, d) appearance of compact keratin as imaged using a 20X, 0.75NA objective. e: A zoom-in SRS image showing the tumor cells. Note the bright cellular and nuclear signal. * indicates the keratinocytes; ** indicates the dermis; arrow marks the keratin filaments.

