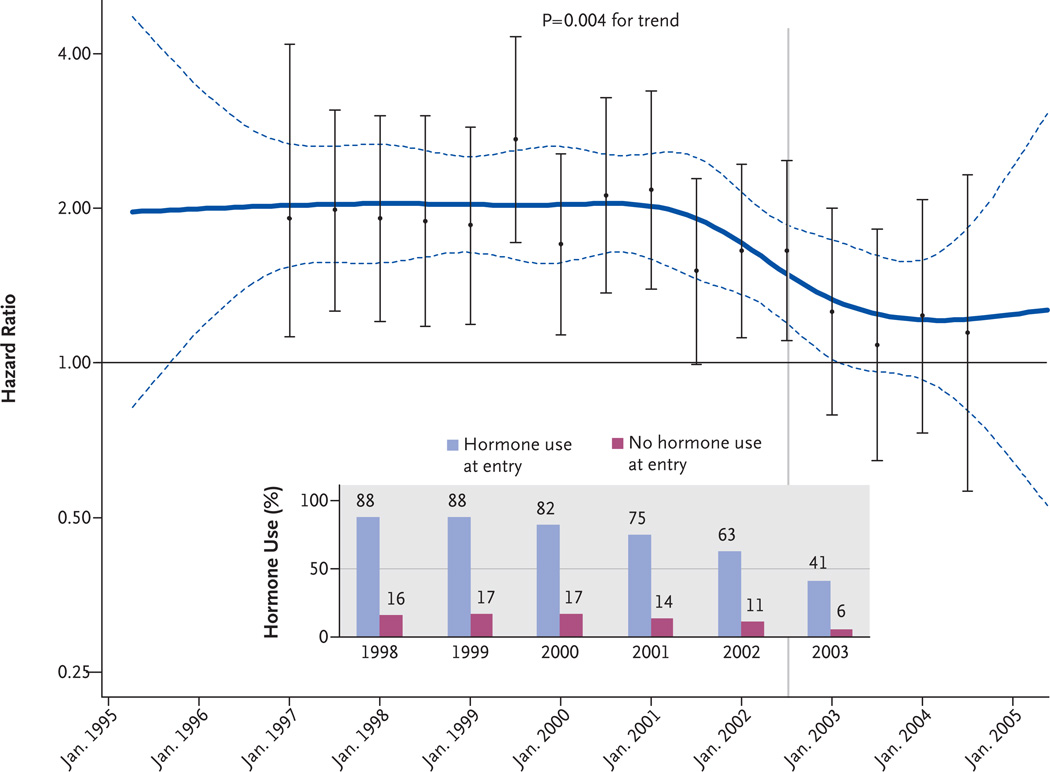
Figure 2. Effects over Time of Estrogen plus Progestin on the Risk of Breast Cancer in the WHI Observational Study.
Smoothed time-varying, multivariable-adjusted hazard ratios and 95% confidence intervals (solid and dashed blue lines, respectively) for the comparison of participants who were taking estrogen plus progestin at study entry with those who were not are shown with the corresponding multivariable-adjusted hazard ratios and 95% confidence intervals from an analysis based on accumulated events at 6-month intervals (I bars). The variables used in this analysis are listed in the Methods section. The vertical line indicates the announcement of the results of the clinical trial in July 2002. The bar graph shows the year-to-year percentages of participants who were taking hormones and those who were not.

