Figure 6.
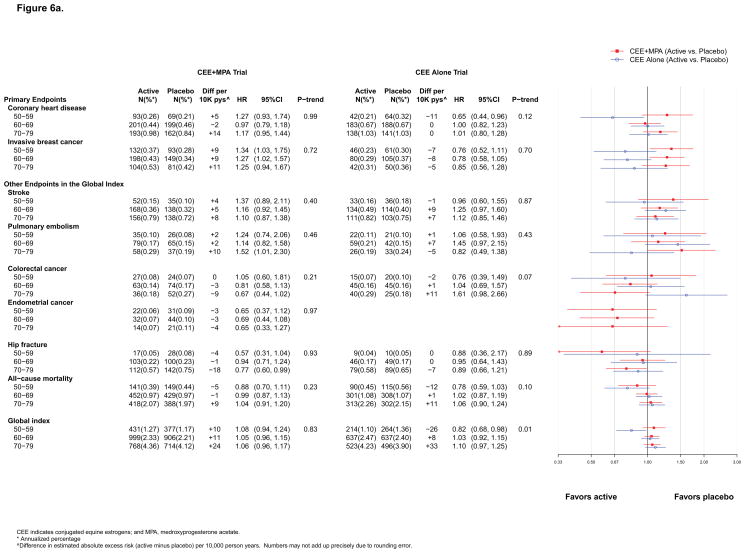
Figure 6a. Number of events (annualized %), difference in absolute risks per 10,000 person–years, and hazard ratios (95%CI) for various health outcomes in the WHI Hormone Therapy Trials (overall combined phases) according to–10 year age groups at randomization.
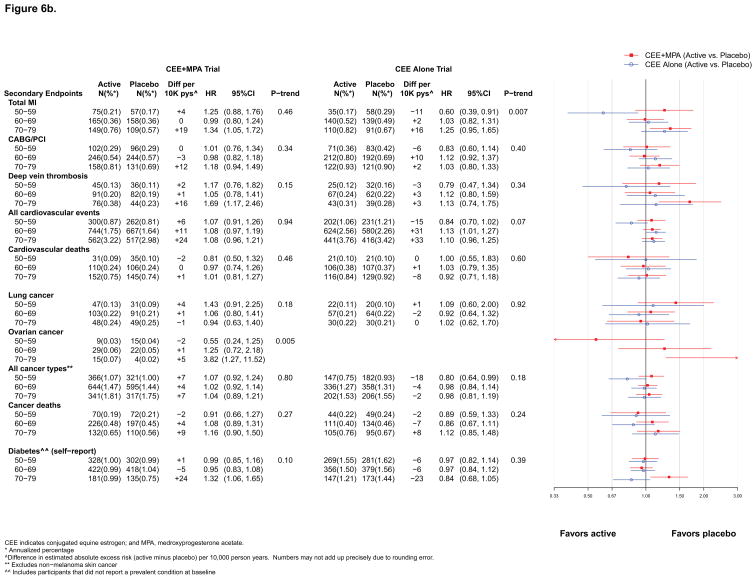
Figure 6b. Number of events (annualized %), difference in absolute risks per 10,000 person–years, and hazard ratios (95%CI) for secondary endpoints in the WHI Hormone Therapy Trials (overall combined phases) according to 10–year age groups at randomization. The total cardiovascular disease outcome is defined in the legend for Figure 2.


