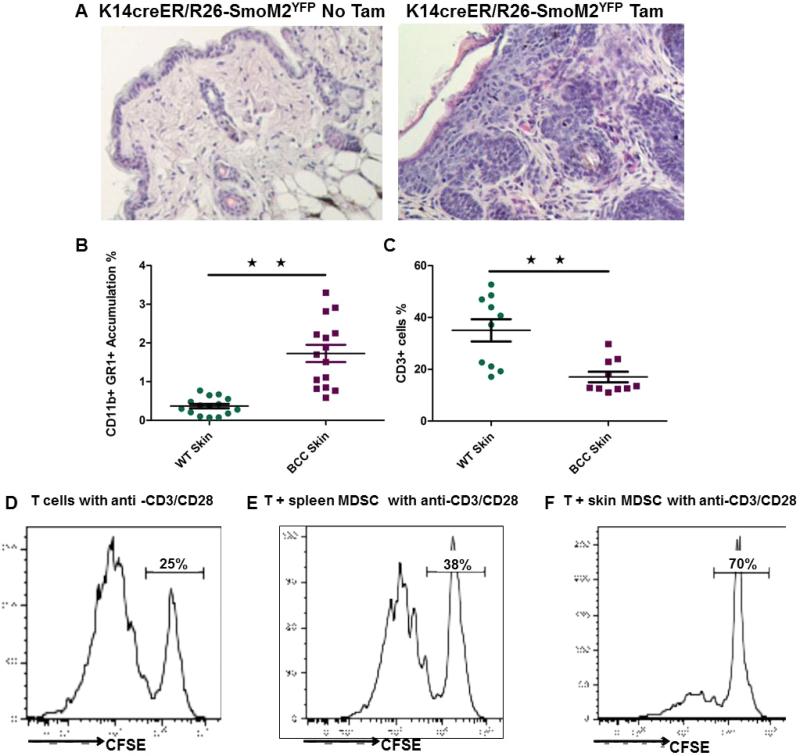
Figure 1. Accumulation of MDSC during SmoM2-mediated skin tumor development.
K14-creER/R26-SmoM2YFP mice can be induced to expression oncogenic SmoM2 in keratinocytes by oral administration of tamoxifen (see Methods). A shows H&E images from mice without (left) or with (right) tamoxifen treatment. B shows flow cytometric results of CD11b+Gr1+ cells, and C shows a summary of T cells (CD3+) in skin tissues. Each dot represented one mouse. D-F show suppressive activities of CD11b+Gr1+ cells isolated from spleen (E) and skin tumors (F) on proliferation of CFSE-labeled T cells. Purified T cells were first labeled with CFSE, and their proliferation was measured by the reduced intensity of CFSE contents after T cell activation with CD3 and CD28 antibodies in the presence or absence (D) of CD11b+Gr1+ cells (see Methods for details). Triplets of samples were used for each experiment and the experiment was repeated three times with similar results. D is the positive control for T cell activation by CD3 and CD28 antibodies.

