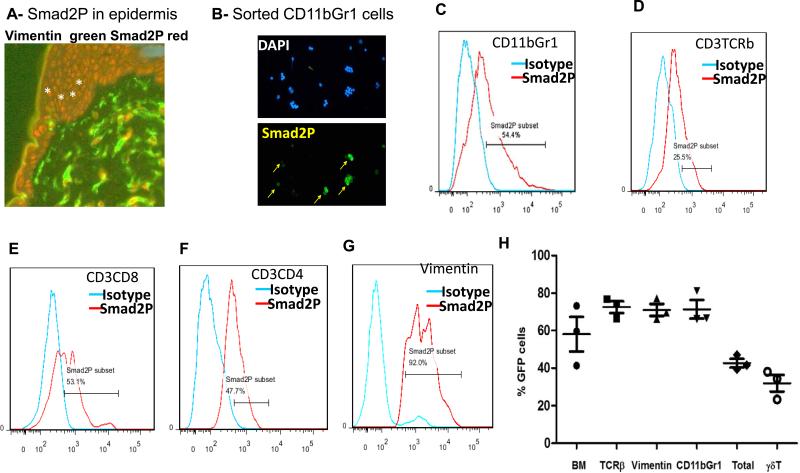
Figure 3. TGFβ signaling activation in different cell populations in SmoM2-derived skin tumors.
The level of TGFβ signaling was indicated by the level of phospho-SMAD2 detected by either flow cytometry of immunofluorescent staining of sorted cell populations. A shows immunofluorescent (IF) staining of phosphorylated SMAD2 in skin of K14creER/R26-SmoM2 mice. Vimentin positive cells (green) indicate fibroblasts. Smad2P (red) was detectable in vimentin positive and vimentin negative cells. Keratinocytes (indicated by *) were mostly positive for Smad2P staining. B shows IF staining of phosphorylated SMAD2 (indicated as Smad2P in green) in sorted CD11b+Gr1+ cells. C shows flow cytometry comparing phosphorylated SMAD2 antibody staining with the isotype control antibody in CD11b+Gr1+ cells. D-G show flow data on Smad2P positive cells (%) in CD3+TCRβ+ (D), CD3+CD8+ (E), CD3+CD4+ (F) and vimentin positive (G) cell population respectively. H shows BM-derived cells in skin tumors as indicated by GFP positivity in different cell populations after transplantation of GFP-expressing BM cells into tamoxifen-treated K14-creER/R26-SmoM2YFP mice.

