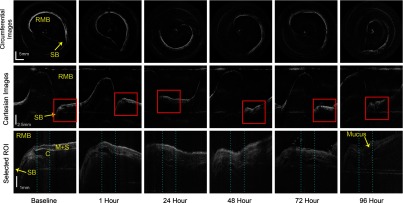
Fig. 5.

OCT images of sheep airway obtained near the proximal secondary bronchus (right upper lobe takeoff) (SB) in the RMB. The image grid is displayed with each row showing the same view, and each column shows the same time point. Top row: circumferential images showing the contour of the airway lumen, the shape and size of the lumen are nearly identical for all the images, the orientation of the cross sections vary due to different starting position of a scan; The emerging SB branch shows up as a “pointy” region on the contour of airway lumen, which corresponds to a “trench-like” region in the Cartesian images. Middle row: Cartesian images of the same cross section as the circumferential images, for easier examination and measurement of the tissue structure; Bottom row: magnified views of the selected regions of interest shown in red boxes in the corresponding Cartesian images above. Thickness of the mucosa and submucosa () for all time points were measured using underlying cartilage (C) as a reference. Blue dotted lines represent the two chosen sites for thickness measurements.
