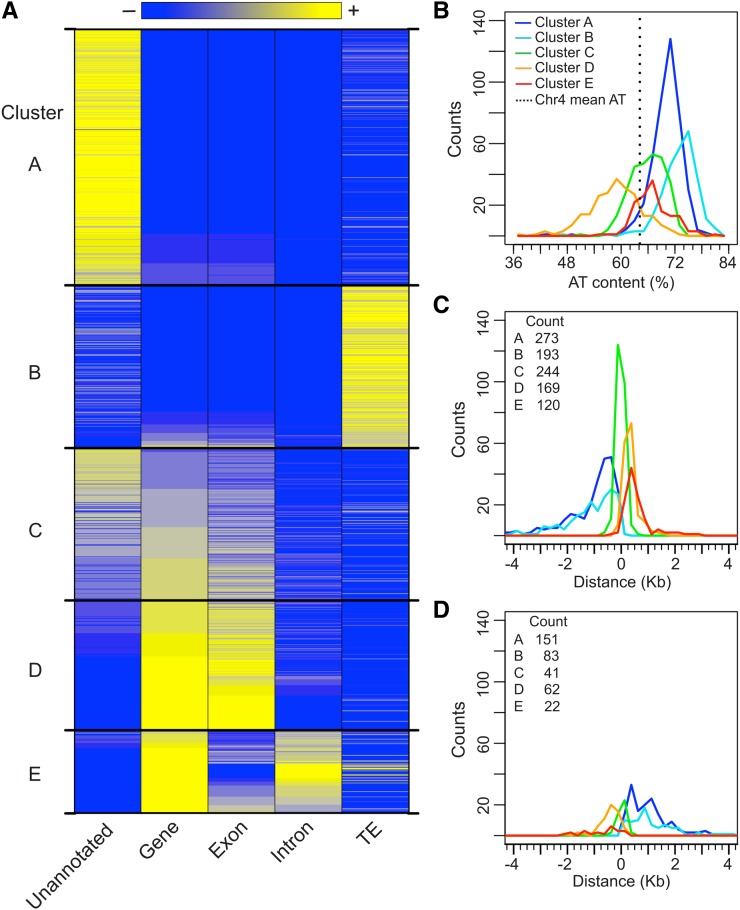
Figure 2.
Genomic Characteristics and Clustering of S/MARs.
(A) K-means clustering of S/MARs based on genomic context. The gene, exon, and TE coverage of each S/MAR was calculated and k-means clustering (k = 5) was performed. The results for each S/MAR within these five clusters are shown as a heat map, using 10% coverage increments. Unannotated and intron coverage is shown but was not used for clustering.
(B) Histograms of S/MAR AT content (%) for each cluster, using bins of 2%.
(C) Histograms of S/MAR position relative to the TSS of the closest gene. S/MARs were first grouped as either TSS- (or TTS)-proximal based on their absolute distance to the TSS or TTS of the nearest (or any overlapping) gene. Distances were calculated and corrected for gene strand so that S/MARs upstream of the TSS have negative values. Histograms were calculated using 250-bp bins, and the plot is restricted to the range ±4 kb (18 outliers are not shown). Also shown is the total count for each S/MAR cluster.
(D) Histograms of S/MAR position relative to the TTS of the closest gene. Distances were calculated as in (C). Two outliers are not shown. Also shown is the total count for each S/MAR cluster.

