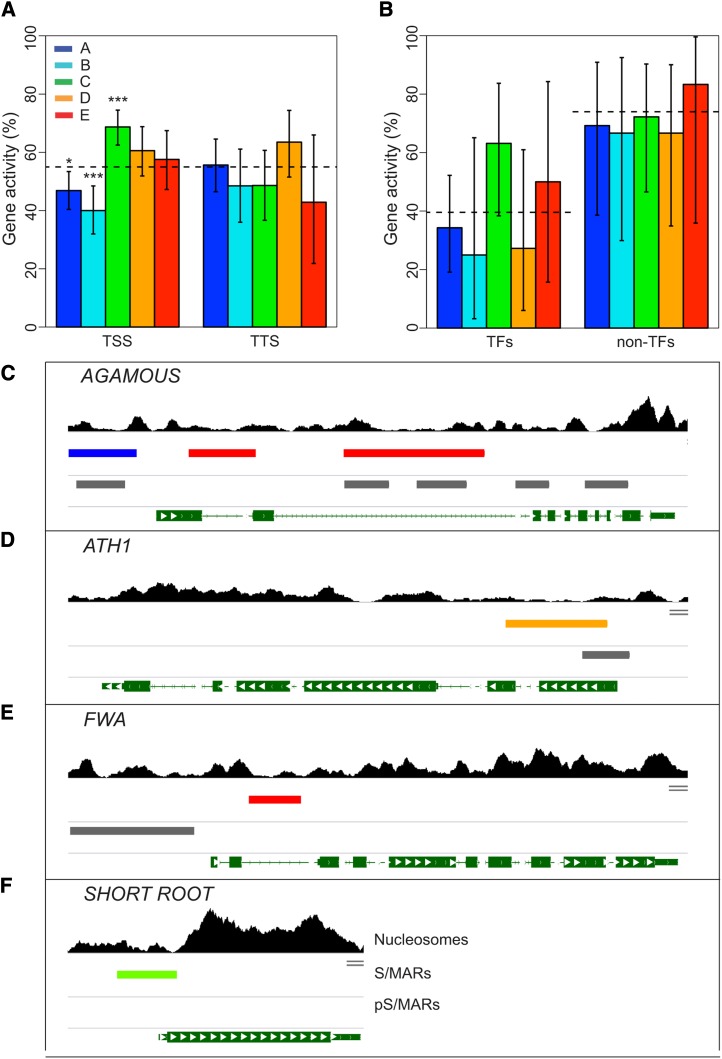
Figure 4.
Correlation of S/MARs with Gene Activity.
The colors shown in the key indicate the respective S/MAR clusters.
(A) All genes that either overlap or are adjacent to an S/MAR were identified and categorized as having either TSS- or TTS-proximal S/MARs based on the location of the closest S/MAR midpoint. Gene activity was determined from MAS5 presence/absence calls from Affymetrix expression experiments for our cell line (Tanurdzic et al., 2008) and is the percentage of genes with detectable mRNA in each category. Totals for the TSS-proximal S/MARs are 239, 145, 243, 137, and 99 for S/MAR clusters A, B, C, D, and E, respectively, and 124, 66, 72, 74, and 21 for S/MAR clusters A, B, C, D, and E, respectively, for the TTS-proximal S/MARs. The dashed line shows the mean for all chr4 genes, and the error bars indicate the 95% confidence interval from the binomial test, and P value significance cutoffs are indicated as follows: *P ≤ 0.05, **P ≤ 0.001, and ***P ≤ 0.0001.
(B) Gene activity for TF genes and non-TF genes in the functional cluster. We identified all transcription associated genes on chr4 based on the enriched GO terms in the identified functional cluster and grouped them as TFs and non-TFs based on the AtTFDB (Palaniswamy et al., 2006). Activity of the transcription-associated genes with no TSS-proximal S/MAR is shown as a dashed line. The total TF genes are 35, 8, 19, 11, and 8 for S/MAR clusters A, B, C, D, and E, respectively, and 13, 9, 18, 12, and 6 for S/MAR clusters A, B, C, D, and E, respectively, for the non-TF genes. The error bars indicate the 95% confidence interval from the binomial test.
(C) to (F) Developmentally important TF genes are associated with S/MARs. Shown are AGAMOUS (C), ATH1 (D), FWA (E), and SHORT ROOT (F) with the S/MARs and pS/MARs indicated. The tracks (top to bottom) are mononucleosome sequence coverage as in Figure 3B. The locations of the S/MARs color-coded by cluster (described above). The locations of the computationally predicted S/MARs (pS/MARs) (Rudd et al., 2004) are shown in gray for comparison. Genes are shown as green segments with exons indicated by boxes and the direction of transcription by white arrows.

