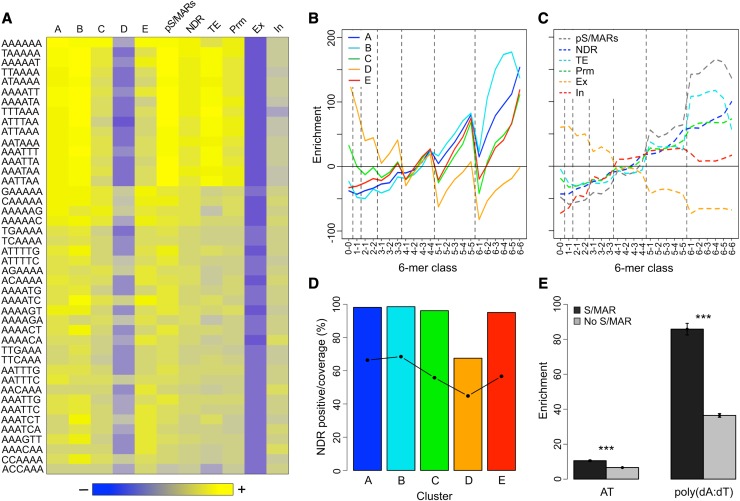
Figure 6.
Analysis of the 6-Mer Content of S/MARs and Associated Regions.
(A) The 6-mer content of S/MARs and select genomic regions. The occurrence of the 2080 nonredundant 6-mers was determined for each S/MAR cluster, pS/MARs, NDRs, promoters (Pr), exons (Ex), introns (In), and TEs on chr4. The heat map shows enrichment data for the 44 overrepresented 6-mers that are in common between S/MAR clusters A, B, C, D, and E. The heat map is scaled so that blue indicates depletion, gray is no enrichment or depletion, and yellow indicates enrichment. The maximum depletion shown is 73%, while the maximum enrichment is 230%.
(B) Enrichment of 6-mer classes as a function of their poly(dA:dT) content for the five S/MAR clusters. All 6-mers were classified based on their poly(dA:dT) content, as described in the text. The dashed lines are included to group the 6-mers by class.
(C) As in (B) but for the following genomic regions: pS/MARs, NDRs, TEs, promoters, exons, and introns.
(D) Percentage of S/MARs by cluster that overlap with a NDR and the NDR sequence coverage for these S/MARs. The percentage of NDR-positive S/MARs is shown as bars, while the NDR sequence coverage is shown by the points and solid line.
(E) Comparison of the enrichment for AT and poly(dA:dT) content of S/MAR-positive and -negative NDRs. NDRs were partitioned into S/MAR-positive and -negative groups, and the AT content relative to chr4 was determined. For poly(dA:dT) content, sequence motifs comprising four or more contiguous As or contiguous Ts were identified for chr4 and for the NDRs, and the poly(dA:dT) enrichment for the NDRs, relative to chr4 was calculated. A Welch two-sample t test was used to compare the NDR groups. The error bars show the 95% confidence intervals for the means. For both comparisons, the difference between the means was highly significant (P ≤ 10−16) as indicated by the asterisks (Supplemental Table 16).

