Figure 2.
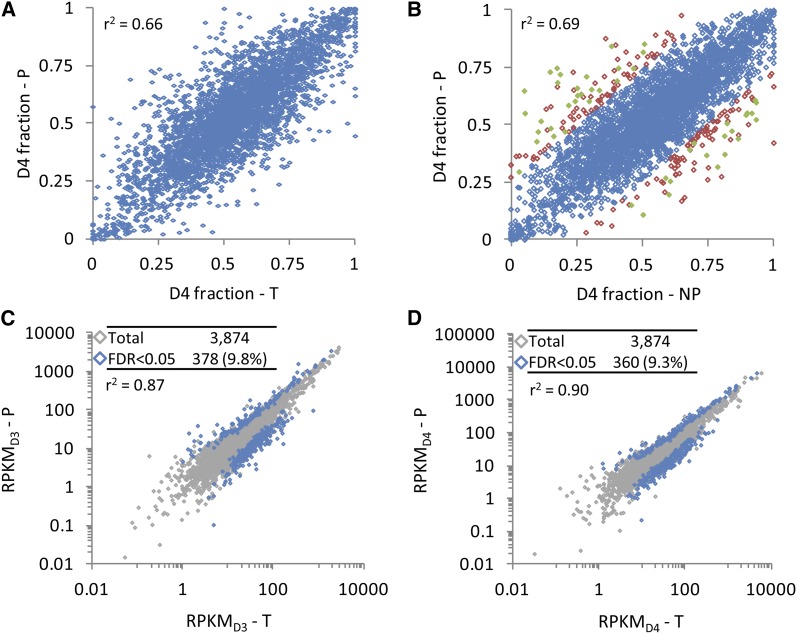
The T2 Transcriptome and Translatome Are Highly Correlated for Relative Homoeolog Usage and for Expression within Each Subgenome.
(A) Scatterplot of relative homoeolog expression (proportion of combined expression derived from the D4 homoeolog) in the homoeolog gene set (n = 3874) for the polysomal (P) versus total (T) mRNA fractions.
(B) Scatterplot of relative homoeolog expression in the polysomal (P) versus nonpolysomal (NP) mRNA fractions. A total of 3669 of 3874 genes (94.7%) showed a shift in relative homoeolog usage of <25% (blue diamonds); of the remaining 205 genes (5.3%) that showed a ≥25% shift in relative homoeolog expression (red or green diamonds), 48 (1.2%; green diamonds) showed a statistically significant shift (translational regulation of relative homoeolog usage; TRRHU).
(C) Scatterplot of D3 homoeolog expression (RPKMD3) in P versus T.
(D) Scatterplot of D4 homoeolog expression (RPKMD4) in P versus T.
Tables in (C) and (D) indicate total number of genes plotted (“Total”; shown in gray) and the number of genes that are differentially expressed at FDR < 0.05 (“FDR < 0.05”; shown in blue).

