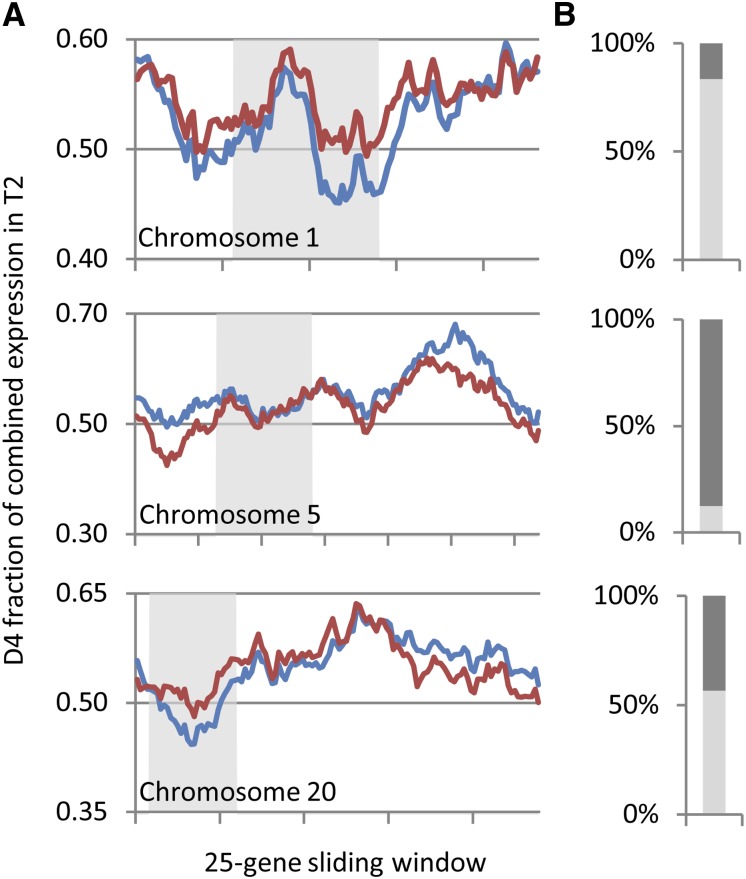
Figure 4.
Translational Regulation Exerts Regional Effects on Homoeolog Usage in T2.
(A) Average D4 homoeolog fraction of combined expression in the T2 transcriptome (T; blue line) and translatome (P; red line) in 25-gene sliding windows across chromosomes 1, 5, and 20. Tick marks on the x axis indicate 25-gene increments (starting from the 25th gene). Gray shading delineates sliding windows in which the majority of genes are located in pericentromeric regions defined by Du et al. (2012).
(B) Percentage of 25-gene windows in which the D4 fraction is increased in P relative to T (light gray) or in which the D4 homoeolog fraction is decreased in P relative to T (dark gray).

