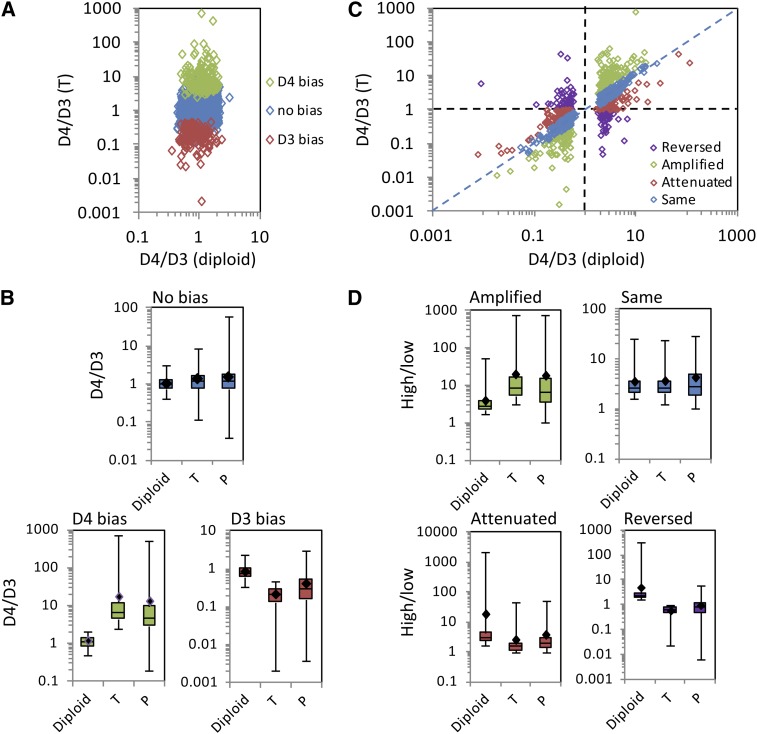
Figure 6.
Translational Regulation Reduces Differences in Homoeolog Usage between T2 and Its Diploid Progenitors.
(A) D4/D3 homoeolog ratios in the T2 transcriptome are plotted against D4/D3 diploid ratios for genes that are equally transcribed in the D3 and D4 diploids (n = 3044). Genes in green show significantly higher expression of the D4 homoeolog than of the D3 homoeolog (“D4 bias”) in the T2 transcriptome. Genes in red show significantly higher expression of the D3 homoeolog than of the D4 homoeolog (“D3 bias”) in the T2 transcriptome. Genes in blue show equal expression of D3 and D4 homoeologs in T2 (“No bias”), consistent with equal expression between D3 and D4 diploids.
(B) Box-and-whisker plots showing D4/D3 ratios in the diploids, the T2 transcriptome (T), and the T2 translatome (P) for each category (no bias, D4 bias, and D3 bias) shown in (A).
(C) D4/D3 homoeolog ratios in the T2 transcriptome are plotted against D4/D3 diploid ratios for genes that are differentially transcribed between D3 and D4 diploids (FDR < 0.05; n = 830). Genes are color coded based on whether the T2 transcriptome preserves (“Same”), amplifies, attenuates, or reverses the D4/D3 ratio relative to the diploids.
(D) Box-and-whisker plots showing ratios (highest expressed at the diploid level/lowest expressed at the diploid level) in the diploids, the T2 transcriptome (T), and the T2 translatome (P) for each category (amplified, same, attenuated, and reversed) shown in (C). In each case where homoeolog usage in the T2 transcriptome differs from relative expression in the diploids, translational regulation partially restores homoeolog usage to a more diploid-like level.

