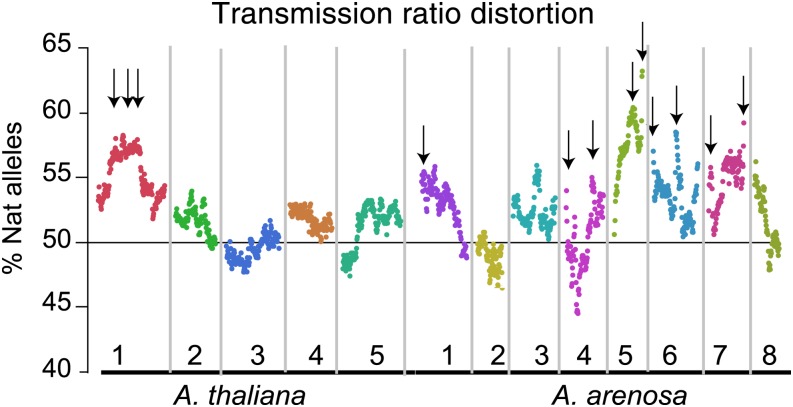
Figure 5.
Transmission Ratio Distortion in the F2.
The mean percentage of allele derived from natural A. suecica in the F2 population was calculated for each marker bin. Different colors represent different chromosomes. Arrows indicate significant distortion from the expected 50% of A. suecica natural allele.
[See online article for color version of this figure.]

