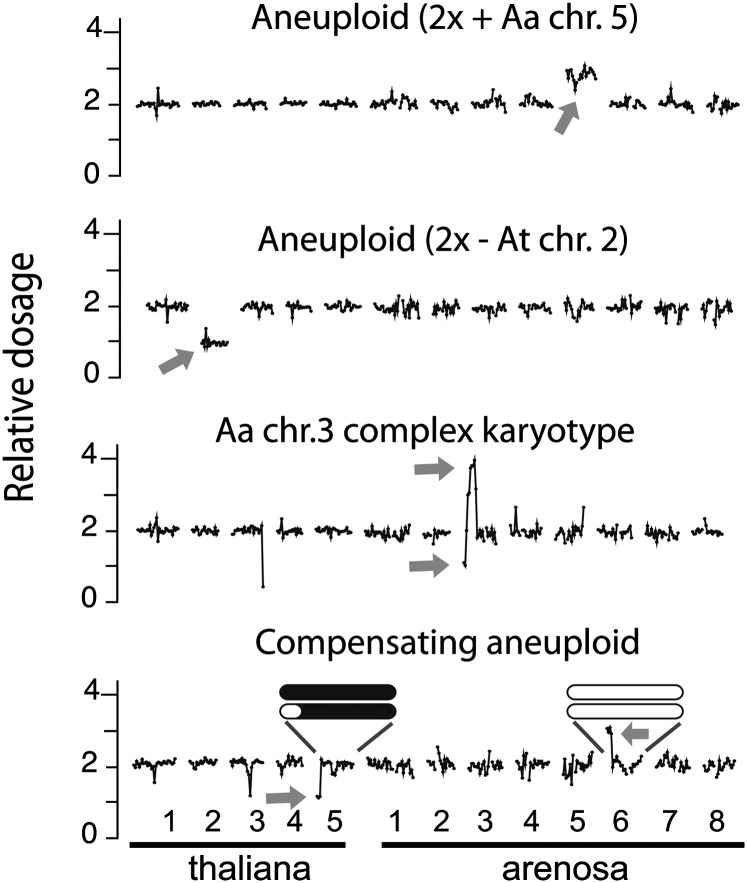
Figure 6.
Dosage Variation in the Syn × Nat F2 Plants.
Examples of individual F2 dosage plots obtained through whole-genome sequencing. Sequencing reads were aligned to the reference genome and sorted into consecutive bins along the 13 chromosomes of the allopolyploid genome. For ease of visualization, relative read coverage is normalized such that fragments present in two copies fluctuated around 2.0. Changes up or down in relative coverage of consecutive bins (arrows) indicates variation in dosage and correspond to the addition or deletion of a particular chromosome or chromosomal fragment, respectively. Relative coverage around the centromeric repeats consistently appears noisy most likely because of mis-mapping, quality of reference sequence, and changes in repeat copy number.

