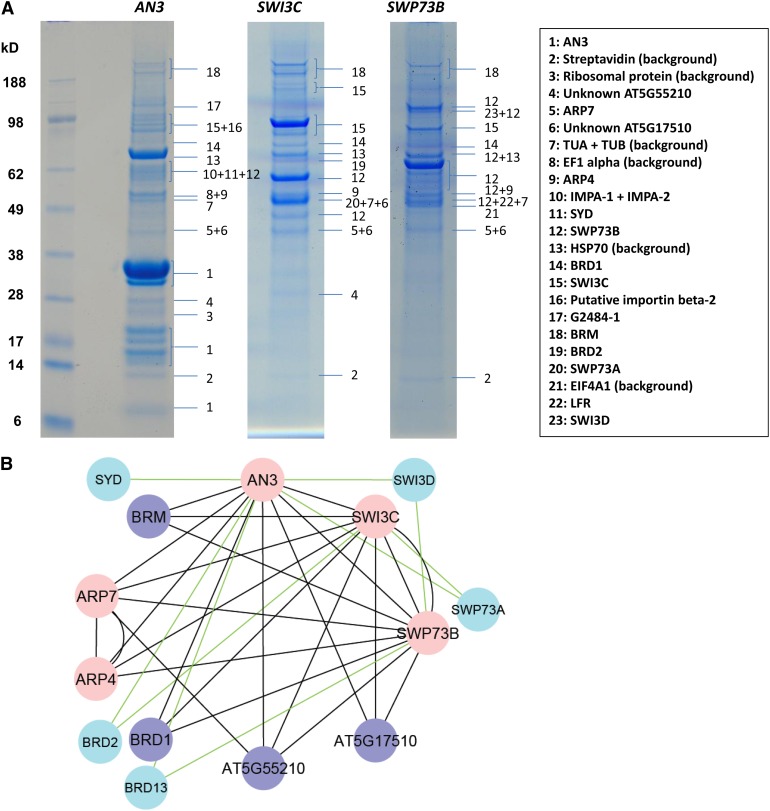
Figure 4.
Tandem Affinity Purification Reveals Interaction of AN3 with SWI/SNF Complexes.
(A) Images of denaturing gels of TAP experiments with C-terminal GS-tagged AN3 and N-terminal GS-tagged SWI3C and SWP73B in cell cultures. Only interactors that could be distinguished as a band are indicated.
(B) Cytoscape (Shannon et al., 2003) protein interaction networks are based on the TAP experiments shown in Table 2. Pink nodes indicate proteins used as bait and purple nodes those that were pulled down with at least three out of five baits. Paralogous proteins identified by AN3 TAP are represented by blue nodes. Black edges are used when the proteins were identified by at least three baits and green edges for proteins identified by one or two bait proteins.

