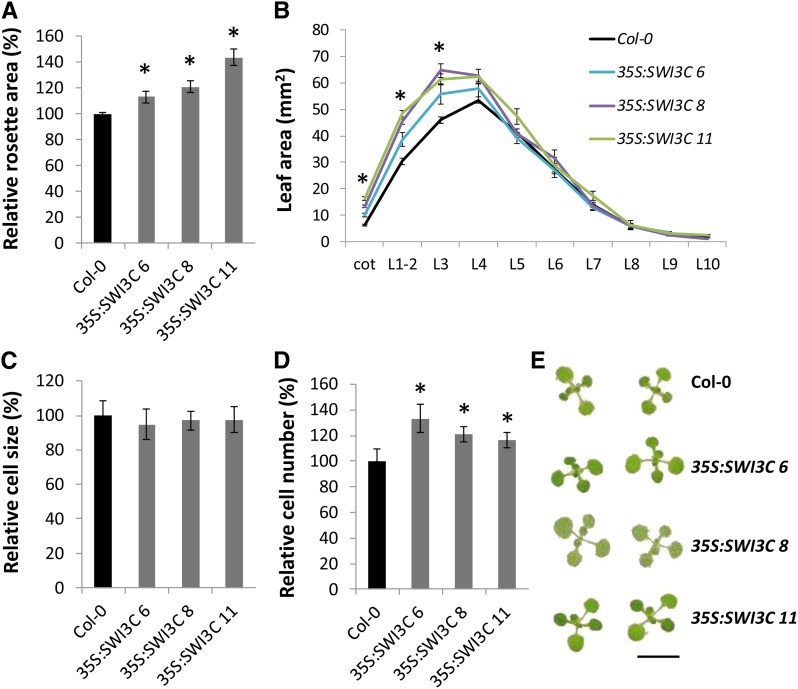
Figure 7.
Overexpression of SWI3C Enhances Leaf Growth.
(A) Total rosette area calculated from individual leaf sizes from 21-d-old 35S:SWI3C plants. Error bars are se (n ≥ 10). Asterisks indicate significant difference from the wild type (Col-0) (P < 0.05, Student’s t test).
(B) Individual cotyledon (Cot) and leaf areas (L1 to L10) measured from leaf series made at 21 DAS from plants with increased leaf growth indicated in (A). Error bars are se (n = 8). Asterisks indicate significant difference from the wild type (Col-0) (P < 0.05, Student’s t test).
(C) and (D) Pavement cell area (C) and pavement cell number (D) of 21-d-old leaves 1 and 2. Error bars are se (n = 6). Asterisks indicate significant difference from the wild type (Col-0) (P < 0.01, Student’s t test).
(E) Rosettes of 15-d-old Col-0 and 35S:SWI3C lines showing enhanced leaf growth. Bar = 10 mm.

