Figure 5.
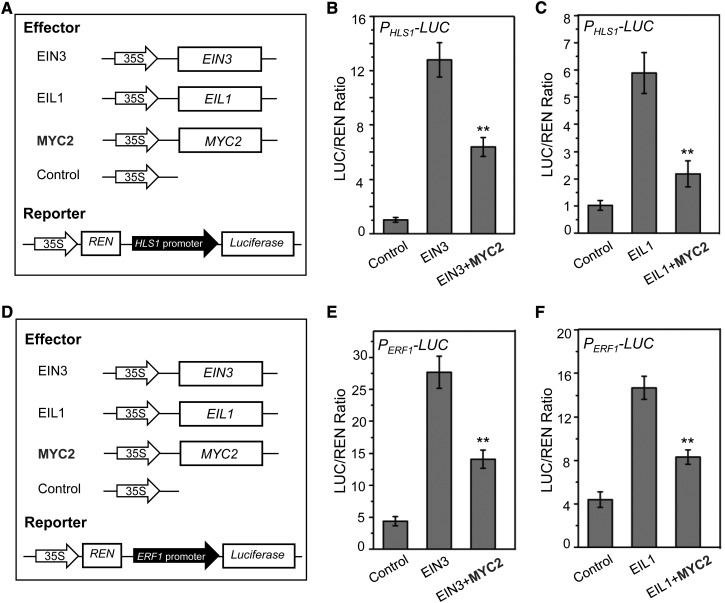
MYC2 Represses Transcriptional Activity of EIN3 and EIL1.
(A) The schematic diagram shows the constructs used in the transient transcriptional activity assays of (B) and (C).
(B) and (C) Transient transcriptional activity assays show that activation of HLS1 promoter by EIN3 (B) and EIL1 (C) is repressed by MYC2. The PHLS1-LUC reporter was cotransformed with the indicated constructs. The LUC/REN ratio represents the PHLS1-LUC activity relative to the internal control (REN driven by 35S promoter). Data are means (±sd) of three biological replicates. Asterisks represent Student’s t test significance between EIN3 and EIN3+MYC2 or EIL1 and EIL1+MYC2 samples (**P < 0.01).
(D) The schematic diagram shows the constructs used in the transient transcriptional activity assays of (E) and (F).
(E) and (F) Transient transcriptional activity assays show that activation of ERF1 promoter by EIN3 (E) and EIL1 (F) is repressed by MYC2. The PERF1-LUC reporter was cotransformed with the indicated constructs. Data are means (±sd) of three biological replicates. Asterisks represent Student’s t test significance between EIN3 and EIN3+MYC2 or EIL1 and EIL1+MYC2 samples (**P < 0.01).

