Figure 1.
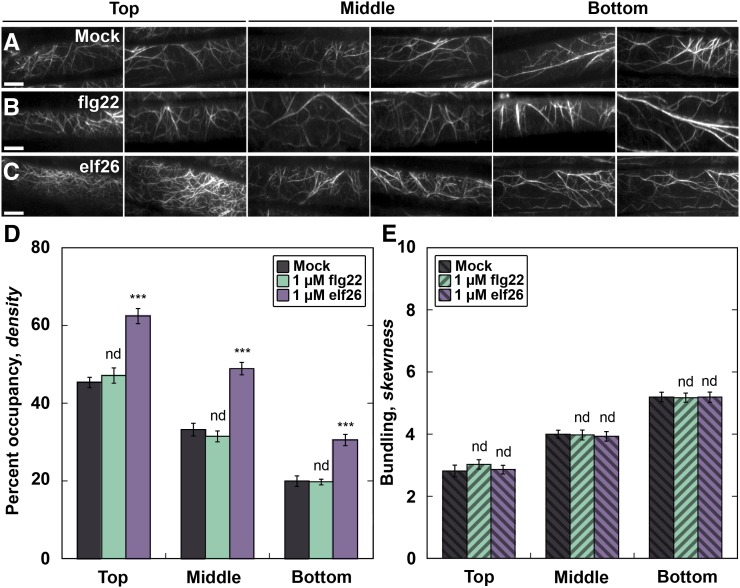
Actin Filament Density Increases following elf26 Treatment.
(A) to (C) VAEM images of hypocotyl epidermal cells expressing GFP-fABD2. Hypocotyls were treated with mock (A), 1 μM flg22 (B), or 1 μM elf26 (C) peptides for 5 min prior to imaging. Images are from individual representative hypocotyls following different treatments, with cells located near the cotyledon (top) at the left and cells located near the root (bottom) at the right. Bars = 10 μm.
(D) Actin filament abundance, or percentage of occupancy, was measured and binned into three equal regions along the length of the hypocotyl. All epidermal cells treated with elf26 had significantly increased filament density throughout the hypocotyl when compared with mock-treated seedlings. However, cells treated with flg22 were not significantly different from mock.
(E) The extent of actin filament bundling, or skewness, was measured from the same images used for (D). There was no significant difference between treatments with flg22, elf26, or mock.
Values given are means ± se (n = 450 cells per region, from at least 30 hypocotyls). Asterisks represent significant differences by ANOVA, with Tukey HSD posthoc analysis (nd = not significantly different from mock; ***P < 0.001).

