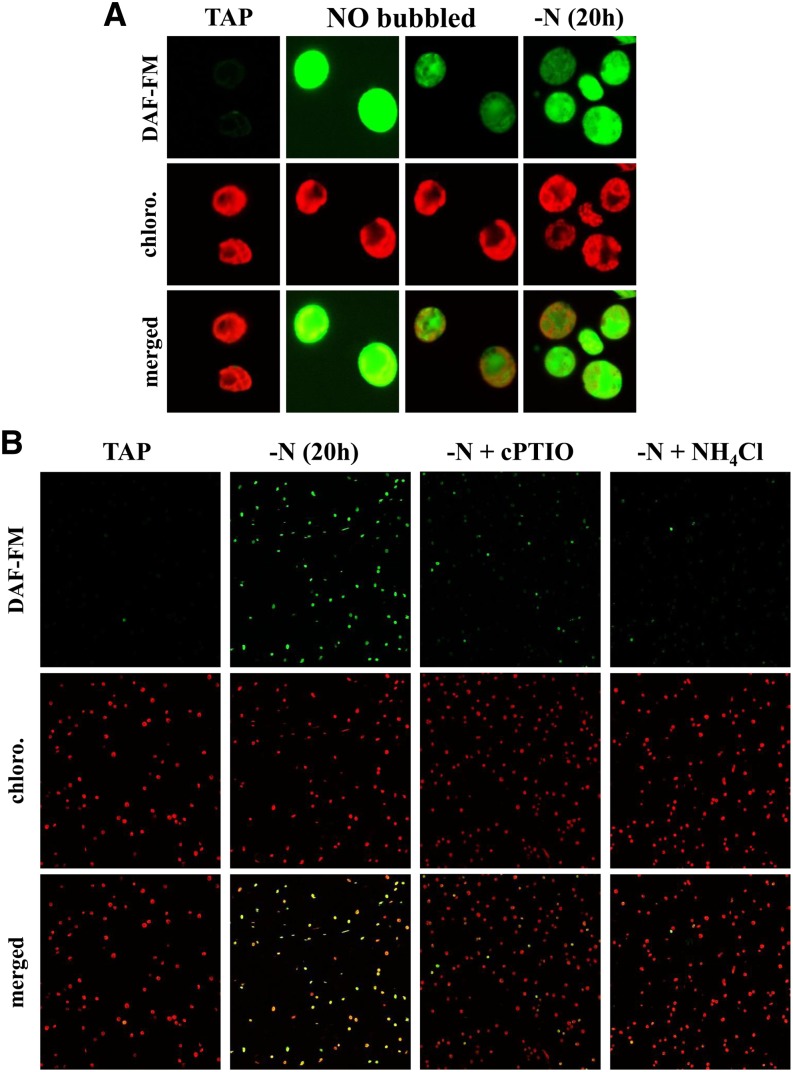
Figure 9.
The DAF-FM Signal Specifically Reflects the Accumulation of NO.
Visualization of in vivo NO production by nitrogen-starved C. reinhardtii cells using confocal microscopy. Green and red fluorescence were due to the NO indicator DAF-FM and chlorophylls, respectively.
(A) Fluorescence pattern of isolated WT-S24 cells grown in TAP medium (TAP), grown in TAP medium and bubbled for 3 min with 10% NO (NO bubbled), or deprived of nitrogen for 20 h [-N(20 h)]. For a better view of the distribution of the green fluorescence in NO-bubbled cells, the same picture is shown on the right, with a lower gain during the acquisition of the green signal.
(B) Confocal images of cell populations grown in TAP (TAP) or deprived of nitrogen in the presence of acetate for 20 h (-N). Imaging was also performed on the same starved culture supplemented with either 0.1 mM cPTIO or 0.5 mM NH4Cl.

