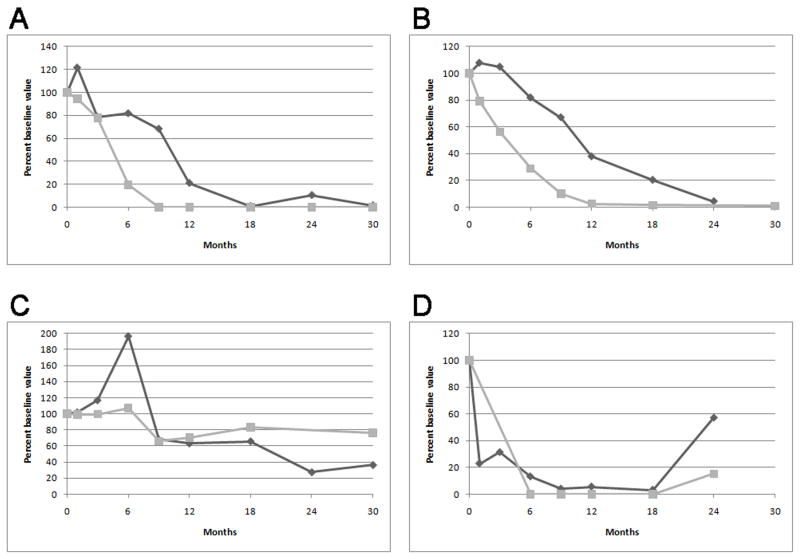
Figure 1.
Representative plots of anti-PLA2R (gray squares) and proteinuria (black diamonds) versus time following initial RTX treatment. Values are plotted as percent of baseline value. Panel (a) and (b) depicts the typical reduction and disappearance of anti-PLA2R followed by resolution of proteinuria exhibited by the majority of patients. Panel (c) is representative of patients in whom anti-PLA2R did not substantially decline following treatment and the associated with persistence of proteinuria. Panel (d) depicts the single patient whose anti-PLA2R level returned with relapse of his disease after having initially disappeared. (From Beck et al. [13] with permission)

