Abstract
High resolution information about the three-dimensional (3D) structure of myosin filaments has always been hard to obtain. Solving the 3D structure of myosin filaments is very important because mutations in human cardiac muscle myosin and its associated proteins (e.g. titin and myosin binding protein C) are known to be associated with a number of familial human cardiomyopathies (e.g. hypertrophic cardiomyopathy and dilated cardiomyopathy). In order to understand how normal heart muscle works and how it fails, as well as the effects of the known mutations on muscle contractility, it is essential to properly understand myosin filament 3D structure and properties in both healthy and diseased hearts.
The aim of this review is firstly to provide a general overview of the 3D structure of myosin thick filaments, as studied so far in both vertebrates and invertebrate striated muscles. Knowledge of this 3D structure is the starting point from which myosin filaments isolated from human cardiomyopathic samples, with known mutations in either myosin or its associated proteins (titin or C-protein), can be studied in detail. This should, in turn, enable us to relate the structure of myosin thick filament to its function and to understanding the disease process. A long term objective of this research would be to assist the design of possible therapeutic solutions to genetic myosin-related human cardiomyopathies.
Keywords: transmission electron microscopy, myosin thick filaments, human cardiomyopathies, single particle image analysis, three-dimensional reconstruction
Structure of vertebrate striated muscles and muscular contraction
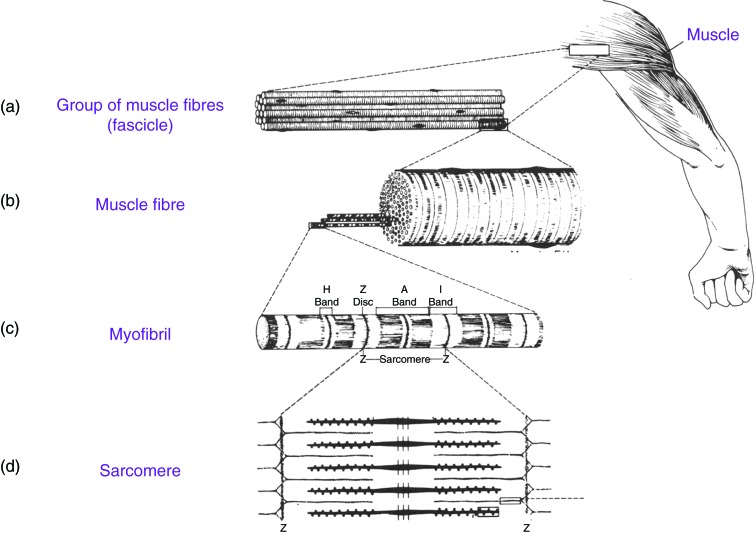
Vertebrate striated muscles, whether skeletal or cardiac, consist of a group of muscle fibres (fascicle), 1–2 mm in diameter for each fascicle. Each muscle fibre, approximately 10–100 μm in diameter and 2–50 nm in length, consists of thousands of myofibrils, 1–2 μm in diameter and 2–50 mm in length, extending from one end of the fibre to the other end (Figure 1).
Figure 1. .
Schematic diagram for the structure of vertebrate striated muscle: (a) Vertebrate striated muscle, whether skeletal or cardiac, consist of a group of muscle fibres (fascicle). (b) Each muscle fibre, approximately 10 to 100 μm in diameter and 2 to 50 nm in length, consists of thousands of myofibrils. (c) Each myofibril is 1 to 2 μm in diameter and 2 to 50 mm in length, extending from one end of the fibre to the other end. When viewed under the light microscope, the myofibrils have distinct features of alternating light and dark bands running along their lengths. These are termed the A-bands and I-bands. The Z-bands are where the actin filaments start from and project in two opposite directions towards the I-bands. (d) Under higher magnification, the myofibril is seen to have a building block that repeats along its lengths. This is called the sarcomere and it represents the main functional repeating unit of the myofibril. The sarcomere is approximately 2 to 3 μm in length and it extends between two Z-bands. It contains overlapping parallel arrays of actin thin filaments and myosin thick filaments.
When viewed under a microscope, myofibrils have distinct features of alternating light and dark bands running along their lengths (Figure 1c). These are termed A-bands (ansitropic) and I-bands (isotropic). The A-bands are dense and dark as they contain higher concentration of protein, have high refractive index and are strongly birefringent. In contrast, I-bands are less dense, light areas, have low refractive index and are weakly birefringent. Under higher magnification, the myofibril is seen to have a building block that repeats along its length. This is called the sarcomere (Figure 1d) and it represents the main functional repeating unit of the myofibril.
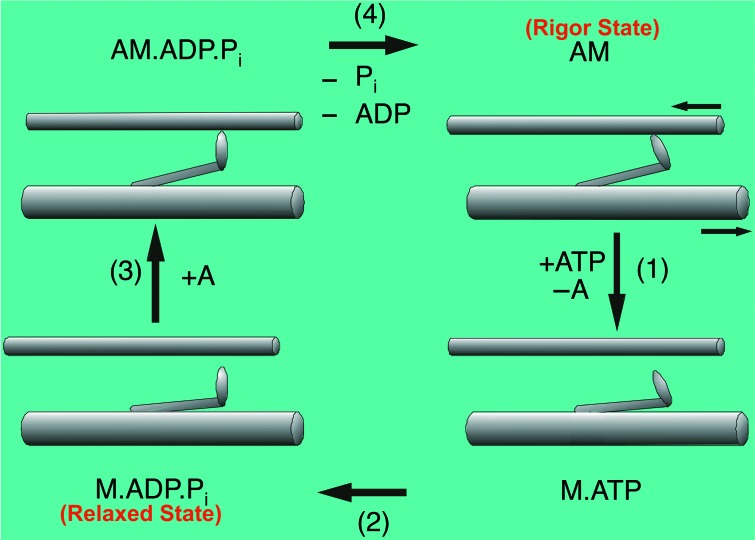
The sarcomere is approximately 2–3 μm in length, and consists of overlapping parallel arrays of actin [thin] filaments and myosin [thick] filaments. It is the cyclic interaction between these two sets of filaments, fuelled by the hydrolysis of adenosine triphosphate (ATP), which generates a mechanical force to make the actin and myosin filaments slide past each other during muscle contraction, shortening the sarcomere length without any change in length of either kind of filament. This is the basis of two important early concepts fundamental to understanding the molecular basis of muscular contraction: the ‘sliding filament model’,1,2 and the swinging crossbridge model.3 The latter formulates a hypothesis to explain how the hydrolysis of ATP, and the release of the two hydrolysis products, adenosine diphosphate (ADP) and inorganic phosphate (Pi) converts chemical energy into mechanical energy and motion, leading to contraction. This is shown schematically in Figure 2.
Figure 2. .
Schematic diagram showing how chemical energy is transformed into mechanical energy and motion. This describes the force-generating crossbridge cycle during muscular contraction through the hydrolysis of ATP and the release of the hydrolysis products, ADP and Pi. Top right: this first state resembles the rigor state of the muscle when there is no ATP. In this state, the myosin heads projecting out from the myosin filaments, are tightly attached onto the actin filaments in a specific configuration at an angle of 45° relative to the actin filaments. This forms a strong binding for the actin-myosin or actomyosin complex, referred to as AM (‘A’ refers to actin and ‘M’ refers to myosin). Bottom right: If ATP is added to this state, the myosin heads get detached from actin filaments and form the second state, being the M.ATP complex with the ATP bound to the myosin heads. Bottom left: ATP is hydrolysed into its two products, ADP and Pi, with both these two products staying bound to the myosin heads forming M.ADP.Pi complex. This hydrolysis event results in a conformational change of the myosin heads, by them changing their angles from 45° to 90° relative to the actin filaments. This third state resembles the relaxed state of the muscle and at this state, the myosin heads like to bind to actin filaments and then convert to the fourth state (Top left) forming the AM.ADP.Pi complex, with the two hydrolysis products still bound to the myosin heads. Later, the two products are then released (Pi first then ADP) from the myosin heads and this causes a second conformational change of the myosin heads, by them changing their angles from 90° to 45° relative to the actin filaments and, yet again, going back to the first state (Top right) whereby forming the rigor actomyosin AM complex. This change of angle of the myosin heads causes the pulling of the actin filaments towards the centre of the sarcomere and hence the shortening of the sarcomere length and the sliding filament model.
The first state (Figure 2: top right), resembles the rigor mortis state of the muscle, the state the muscle reaches after death, where ATP is no longer produced. In this state, the myosin heads [also known as crossbridges or S1's (Subfragment-1)] projecting out from the myosin filaments, are tightly attached to the actin filaments in a specific configuration at an angle of 45° relative to the actin filaments. This forms a strong binding for the actin-myosin, or actomyosin complex (AM). If ATP is added to this state, the myosin heads get detached from the actin filaments and form the second state, the M.ATP complex (Figure 2: bottom right), with ATP bound to the myosin heads. Since the myosin heads are ATPases, i.e. they act as enzymes which hydrolyse the ATP molecules, this therefore results in the ATP being hydrolysed into its two products, ADP and Pi, with both these two products staying bound to the myosin heads forming the M.ADP.Pi complex. This hydrolysis event results in a conformational change of the myosin heads, changing their angles from 45° to 90° relative to the actin filaments. The third state (Figure 2: bottom left) resembles the relaxed state of the muscle and in this state, the myosin heads like to bind to actin filaments and then convert to the fourth state (Figure 2: top left) forming the AM.ADP.Pi complex, with the two hydrolysis products still bound to the myosin heads. The two hydrolysis products are then released from the myosin heads (Pi released first, then ADP) and this causes a second conformational change of the myosin heads, changing their angles back from 90° to 45° relative to the actin filaments, thus going back to the first state (Figure 2: top right) of the rigor actomyosin AM complex. This change of angle of the myosin heads results in the pulling of the actin filaments towards the centre of the sarcomere and hence the shortening of the sarcomere length. In summary, there are two conformational changes for the myosin heads:- one when the ATP is hydrolysed into its two products, while they are still bound to the myosin heads, and the second when the two hydrolysis products are released from the myosin heads.
The sarcomere: actin and myosin filaments
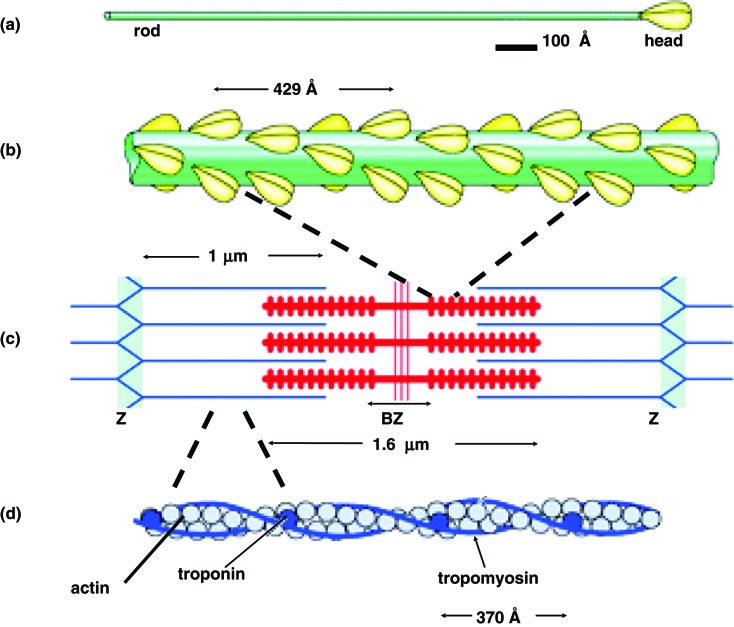
The two main components of vertebrate striated muscle sarcomeres are actin and myosin filaments. Myosin filament is 1.6 μm in length, approximately 300 Å in diameter and has an axial repeat of 429 Å along its length (Figure 3b,c). Actin filament is 1.0 μm in length, approximately 100 Å in diameter and has an axial repeat of 370 Å (Figure 3c,d). As well as different axial repeats, actin and myosin filaments have different rotational symmetry and helical symmetry.
Figure 3. .
The main components of muscle sarcomere, actin and myosin filaments. (a) The myosin molecule has a tail of length 1500 Å and two elongated globular myosin heads, referred to S1's (Subfragment-1) or crossbridges, each has a dimension of 150 Å. (b) The myosin filament is 1.6 μm in length and approximately 300 Å in diameter with an axial repeat of 429 Å along its length. It consists of myosin molecules. (c) The sarcomere consists of overlapping parallel arrays of actin and myosin filaments and extends between two Z-bands (labelled Z). BZ is the barezone or the M-region where there are no myosin heads at the centre of which (three vertical red stripes) are the M-band proteins which interconnect the myosin filaments at the centre of the sarcomere. (d) The actin filament is 1.0 μm in length and approximately 100 Å in diameter with an axial repeat of 370 Å. It consists of three main proteins: the actin monomer, troponin complex (comprising three protein components:- troponin-I, troponin-C and troponin-T) and two strands of tropomyosin molecules.
Rotational symmetry is defined by the number of strands present. Actin filament has two strands and hence has a 2-fold (C2) rotational symmetry; myosin filament has three strands and hence has a 3-fold (C3) rotational symmetry. Helical symmetry is defined by the integral number of sub-units contained in a given number of turns in a single strand. So for example actin filament strands have a 13/6 helix, i.e. thirteen subunits in six turns of a strand, whereas myosin strands have a 9/1 helix, i.e. nine subunits in one turn of its strand.
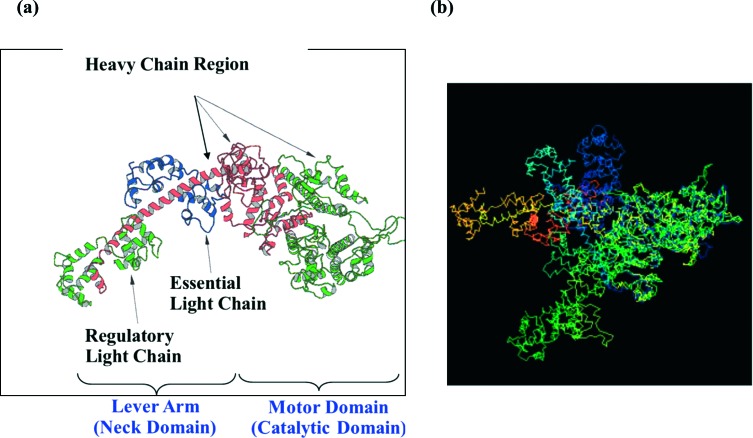
An actin filament consists of three main proteins:- actin monomer, troponin complex (comprising three proteins, troponin-I, troponin-C and troponin-T) and two strands of tropomyosin molecules (Figure 3d). Myosin filaments consist of myosin molecules, each having a tail of length 1500 Å and two elongated globular myosin heads, each with a dimension of 150 Å (Figure 3a). Myosin molecules comprise two heavy chains and four light chains. The C-terminal parts of the myosin heavy chains (MHC) twist together to form the 1500 Å-long coiled-coil α-helical rod-shaped tail domain (Figure 3a). The N-terminal parts of the heavy chains form the two myosin heads (Figure 4a). Each head has the N-terminal part of that heavy chain as well as two light chains, named the essential light chain (ELC) and the regulatory light chain (RLC) (Figure 4a). The way in which myosin molecules and accessory proteins associate to form a myosin filament can vary depending on the type of muscle. Generally the tails pack together, often in a helical arrangement, to form the filament backbone from which the myosin heads project (Figure 3b).
Figure 4. .
(a) Structure of the myosin head in the rigor state with no nucleotide bound solved by X-ray crystallography (4). The head consists of a single heavy chain and two light chains, named the essential light chain (ELC) and the regulatory light chain (RLC). It has a motor domain and a neck domain or lever arm. The motor domain is the catalytic domain which has an ATP-binding site and the actin-binding site. The lever arm is a single α-helical with the two light chains (ELC and RLC) bound to it and it connects to the rod portion of the myosin molecules forming the backbone. There are two heads connected to the rod which form a myosin molecule (shown Figure 3a). (b) Comparison of the myosin head structure from various published crystal structures with different nucleotides bound. All the structures are superimposed at the catalytic motor domain, so that the differences between the models are expressed by the different positions of their lever arms. Green and pointing slightly towards the viewer is the 4 chicken skeletal myosin with no nucleotide bound (i.e. rigor-like); dark blue is the 5 chicken smooth muscle myosin in ADP.AlF4 form; pale blue is the Lethocerus structure in the relaxed state (6); orange is the 7 scallop myosin in Mg.ADP.VO4 form. The view is in the direction such that the actin filament axis is vertical and to the right of the myosin head, with the M-band at the top and Z-band at the bottom.
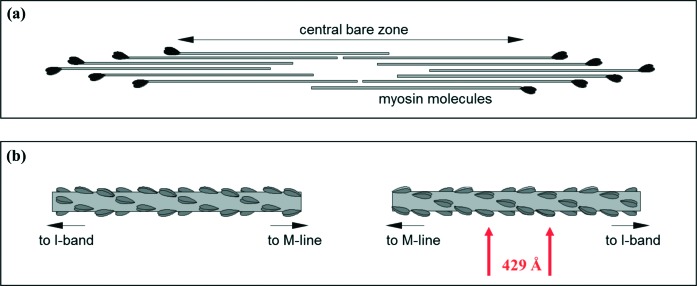
In vertebrate striated muscles, the assembly of myosin molecules is arranged in such a way as to form bipolar filaments, with a central bare zone or M-region, where there are no myosin heads, corresponding to the centre of the sarcomere (Figure 5a). The myosin molecules pack together to form a cylindrical filament, with their rod portions as the backbone structure and the myosin heads arranged in a quasi-helical array on the filament surface, forming an approximate three-stranded helix with an axial repeat of 429 Å (Figure 5b). The backbone also has on its surface additional non-myosin protein components including myosin binding protein-C (MyBP-C)8 and the A-band part of titin.9,10
Figure 5. .
Myosin thick filaments and bi-polar structures. (a) Myosin molecules aggregate in such a way as to form bi-polar filaments, with a central barezone (no myosin heads) corresponding to the centre of the sarcomere. (b) The myosin filament pack in a way that forms a cylindrical filament with the rod portions of the myosin molecules forming the backbone and the myosin heads (crossbridges) arranged in a quasi-helical array on the surface, forming an approximate three-stranded helix with an axial repeat of 429 Å, arrowed in red.
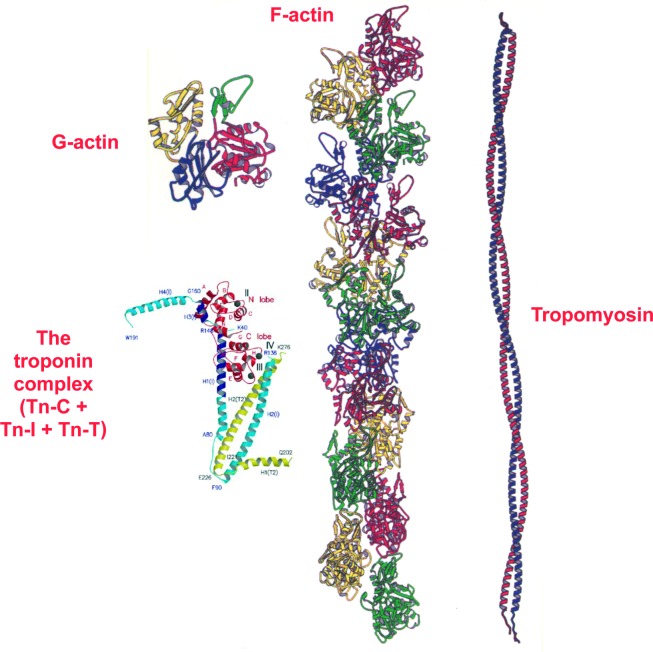
The actin filament structure has already been resolved by several research groups to a high resolution whether for the whole actin thin filament11,12 or for each of its four main protein components individually:- the actin monomer (referred to as G-actin; G stands for globular) solved by X-ray crystallography,13 F-actin (F stand for filamentous),14–16 tropomyosin17 and troponin complex (Figure 6).18 However, myosin filament 3D structure is still not yet resolved to a high resolution.
Figure 6. .
Components of the actin thin filament structure. Actin has four main components. The actin monomer (referred to as G-actin, G stands for globular) solved by X-ray crystallography (13), F-actin (F stand for filamentous) (14), tropomyosin (17) and troponin complex (18) comprising three components, troponin-C (TN-C), troponin-I (TN-I) and troponin-T (TN-T).
Arrangement of myosin heads on the surface of myosin filaments in vertebrates and invertebrates striated muscles
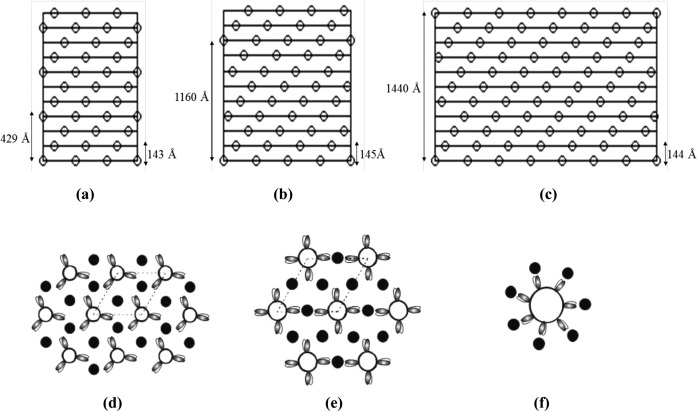
Several research groups have concentrated on studying the overall 3D arrangements of the myosin heads on the myosin filaments of various muscles from different species, both from invertebrates to vertebrates (for reviews, see 19–21). Figure 7 shows a schematic diagram of how the surface helical nets of myosin filaments from the striated muscles of different species vary. Surface helical nets describe the way the pairs of myosin heads are arranged on the backbone surface of the myosin filaments, when viewed from the outside of the filament. For the striated muscles of vertebrates, e.g. fish, rabbit, mouse, frog and human, the myosin heads are arranged on a three-stranded right-handed helical arrangement which has perturbation from a true helical symmetry and hence is referred to as a quasi-helical arrangement, but for simplicity, it is shown as true helices in Figure 7(a).22–29 Each strand possesses nine subunits (pairs of myosin heads) per full turn of 1287 Å. Since the filament is 3-stranded, the axial repeat is reduced by one-third, from 1287 Å to 429 Å. The pairs of heads from three myosin molecules project from the backbone at regular intervals to form a so-called ‘crown’ of heads, with successive crowns separated axially by roughly 143 Å. Each 429 Å axial repeat contains three such crowns. The 3-stranded vertebrate striated muscle myosin filaments are characterised by a systematic departure from a true helical symmetry, known as a perturbation. This was originally identified by the presence of ‘forbidden’ meridional reflections (i.e. X-ray meridional reflections seen at orders of the 429 Å repeat other than multiples of 3) observed in the X-ray diffraction patterns from relaxed vertebrate skeletal muscles.30 This perturbation could be due to the presence and binding of non-myosin accessory proteins, for example C-protein or titin, to the myosin filaments, or could be due to the packing of the myosin rods (Figure 5a).
Figure 7. .
Surface helical nets of myosin filaments from striated muscles from different species, vertebrates and invertebrate, all having a 143–145 Å axial separation between the crown levels. (a) Myosin filaments from vertebrate striated muscles from fish, rabbit, mouse, frog and human are all three-stranded and have an axial helical repeat of 429 Å. (b) Myosin filaments from insect flight muscle are four-stranded and with axial repeat of 1160 Å. (c) Myosin filaments in scallop pecten muscle are seven-stranded and have an axial repeat of 1440 Å. (d-f) Schematic drawing of a cross-section through the myosin and actin filament lattices within the A-band regions in different muscles. (b) fish skeletal muscle. (e) insect fibrillar flight muscle (f) scallop pecten muscle. The dotted lines in (d) and (e) outline the repeating unit cell within the lattice arrangement.
In general, myosin filaments from both vertebrates and invertebrates muscles share a number of structural features. The myosin heads in relaxed myosin filaments from different species, vertebrates and invertebrates, are arranged on the surface of the filament backbone on multi-stranded, parallel helices and are helically or approximately helically ordered. Myosin filaments in invertebrate striated muscles have a greater number of strands compared to myosin filaments in vertebrate striated muscles. For example, the myosin heads arrangement in the striated muscles of an insect flights thorax muscle (Lethocerus) is four-stranded and has an axial repeat of about 1160 Å (Figure 7b).6,31 The myosin filaments from an insect leg muscle, a tarantula leg muscle, Limulus (horseshoe crab) telson muscle and scorpion striated muscle are also four-stranded helical structures.6,21,31–35 Myosin filaments from crustacean slow muscle have a five-stranded helical structure with an axial repeat of about 1700 Å.36,37 However, the myosin filaments of scallop striated adductor muscles are seven-stranded helical structures with an axial repeat of 1440 Å (Figure 7c).38–41 The interesting thing is that the axial separation between the myosin heads crown levels in the myosin filaments in each of these different vertebrate and invertebrate species is about 143–145 Å (Figure 7a-c). This implies that this value of axial spacing is important within the context of the full sarcomere, where there are a number of actin filaments surrounding each myosin filament. Since the actin filament is a more-or-less a conserved structure within all species and has similar axial repeat (370 Å), it implies that the value of axial separation between the crown levels of myosin heads within the myosin filaments (regardless of the number of strands or the diameter of the myosin filaments) has to be a similar value within all species, so as to allow a matching of the axial repeats of both sets of actin and myosin filaments in all the different species. It follows that the value of the axial spacing within the myosin filaments is important for optimum interactions and force generation between the actin and myosin filaments within each of these species.
The number of myosin molecules that contribute myosin heads to each crown level defines the rotational symmetry of the filament. In vertebrate striated muscle myosin filaments, there are three myosin molecules that contribute three pairs of myosin heads to each crown level and hence has a three-fold rotational symmetry (Figure 7d). By comparison, myosin filaments from invertebrate striated muscles of insect flight (Figure 7e), Limulus, tarantula and scorpion have four myosin molecules contributing to each crown level, hence there are four pairs of myosin heads on each level and the structure therefore has an overall four-fold rotational symmetry.6,19,21,31–35,42,43 In contrast, myosin filaments in scallop striated muscles have seven pairs of myosin heads on each crown level, originating from a total of seven myosin molecules, thus have seven-fold rotational symmetry (Figure 7f).39–41 This implies that in a scallop muscle, the myosin heads can exert more tension per myosin filament compared to vertebrate striated muscle myosin filament. It is also found that, in a transverse cross-section down the long axis of the A-band region of the sarcomere, each myosin filament from scallop striated muscle is surrounded by seven actin filaments (Figure 7f), compared to vertebrate striated muscles where each myosin filament is surrounded by six actin filaments (Figure 7d). This implies that there are more actin target areas available for the seven pairs of myosin heads on each crown level in scallop striated muscle so that, at any moment in time, all the seven myosin head pairs could be bound to all the surrounding seven actin filaments, compared to vertebrate myosin filaments where the maximum number of attachments could be three pairs of myosin heads with three surrounding actin filaments. Hence more force is produced in the scallop compared to that in vertebrate striated muscles.
In summary, the number of strands in the myosin filaments is related to the function of the muscle and the amount of force they needed to produce during their interactions with their surrounding actin filaments. For example, myosin filaments from scallop adductor muscle are required to produce a high force in order to keep their shells closed.
Both the diameter and the length of the myosin filaments increase systematically with increasing the number of helical strands of myosin molecules. For the three-stranded vertebrates myosin filaments, the diameter is between 300 and 350 Å and the length is about 1.6 μm, whereas for the four-stranded insect, Limulus, tarantula and scorpion, the diameter is between 350 to 450 Å and the length is about 1.8 μm and for scallop adductor muscle myosin filaments, they are about 500 Å in diameter and their length can go up to 2.1 μm.
Structure of myosin heads
The myosin head structure from various species has been revealed by X-ray crystallography in different conformations with different nucleotides bound.4,5,7,44,45Figure 4(a) shows the atomic structure of myosin head from chicken skeletal muscle with no nucleotide bound and therefore representing the rigor state of the head structure.4 It has one single heavy chain and two light chains. The myosin head has a motor domain and a neck domain, which is also called the lever arm. The motor domain is the catalytic domain which has an ATP-binding site and the actin-binding site. The lever arm is a single α-helical with the two light chains (ELC and RLC) bound to it and it connects to the rod portion of the myosin molecules forming the backbone. There are two heads connected to the rod which form a myosin molecule (Figure 3a).
When comparing the crystal structures of the myosin head from different species and in different conformations resulting from the different nucleotides bound, e.g. ATP, ADP, ADP.Pi, Mg.ATP etc., it was found that they all have similar structures for the motor domains parts, when they are superimposed together. The only difference is in the conformation of the lever arms, which were found to move/swing axially relative to the motor domain (Figure 4b). This enabled muscle researchers to propose a model for the changes of the head structure during muscle contraction and to relate each crystal structure with the swinging crossbridge model (Figure 2) during the hydrolysis of ATP and the release of its products. They later revised the swinging crossbridge model and explained the conformational changes of the whole myosin heads to be actually due to the swinging of the lever arm rather than the whole of the myosin head, with the motor domain interacting relatively rigidly with the actin filaments during both the hydrolysis of ATP and, later, the release of the products.46–49 The motor domain of the head remaining in the same configuration, but the overall conformation change of the lever arm still gives rise to the same pulling of the actin filaments past the myosin filaments and towards the centre of the sarcomere, as explained by the original model (Figure 2). Therefore and as a result of studying the crystal structures of myosin head, understanding of muscle contraction evolved from the swinging crossbridge model to a swinging lever arm hypothesis.48
Electron microscopy of myosin filaments from vertebrate striated muscles
One of the main methods to study the structure of myosin filaments from vertebrate striated muscles is transmission electron microscopy (TEM) and image analysis. To date this has included the analysis of images of negatively stained myosin filaments from fish, frog, chicken, mouse and rabbit skeletal muscles.26,27,29,50–54 These studies have shown the presence of the perturbation in 3-stranded crossbridge arrangement in all these species, consistent with the perturbation first described by Huxley and Brown30. However, they could not definitively demonstrate the nature of the perturbation, nor produced a detailed 3D structure of the myosin filaments in vertebrate striated muscles. Single particle image analysis of EM images been successfully used on myosin filaments isolated from fish skeletal muscle,22,55,56 rabbit heart muscle,23 mouse heart muscles25 and most recently myosin filaments from human heart muscles.24,57
Why study 3D structure of myosin filament from human heart muscle
Mutations in cardiac muscle myosin filaments, whether in the myosin heavy chains (MHC), ELC or RLC, or in its associated proteins (e.g. MyBP-C and titin) are known to be associated with a number of cardiomyopathies, including hypertrophic cardiomyopathy (HCM) and dilated cardiomyopathy (DCM), which change the proteins involved in producing and regulating heart muscle contraction. If we are to understand how muscle works, and also how it fails, it is essential to properly understand the myosin filament 3D structure in both the diseased and undiseased state of the heart muscle. This then allows us to understand how these mutations cause the change in the 3D structure of myosin filaments, by direct comparison of the structure from a normal undiseased heart with the one obtained from a diseased heart. We can then relate the myosin filament 3D structure to its function, as well as to the disease state and process. This therefore has the potential to enable researchers to design possible treatments for such diseases.
Table 1 shows the different mutations in nine contractile/sarcomeric protein genes that cause HCM. It can be seen that the majority are in the MHC and in MyBP-C, which together, represent a total of over 80% of the HCM cases.58–66 This therefore makes them important types of genes to be studied using the method of isolating myosin filaments, followed by electron microscopy and single particle image analysis.
Table 1 .
Hypertrophic cardiomyopathy is caused by mutations in nine contractile/sarcomeric protein genes of which the majority are in the myosin heavy chain and in MyBP-C forming a total of about 82% of the cases (shown in italic).
| % of cases | |
| Thick filament: | |
| β-myosin heavy chain (βMyHC) | 40 |
| Myosin regulatory light chain (RLC) | < 5 |
| Myosin essential light chain (ELC) | < 1 |
| Thick filament-associated: | |
| Cardiac myosin binding protein-C (MyBP-C) | 42 |
| Titin | < 5 |
| Thin filament: | |
| Cardiac actin (cActin) | < 5 |
| α-tropomyosin (αTM) | < 5 |
| Cardiac troponin T (cTnT) | < 5 |
| Cardiac troponin I (cTnl) | < 5 |
Isolating myosin filaments from human heart muscle and two-dimensional EM analysis
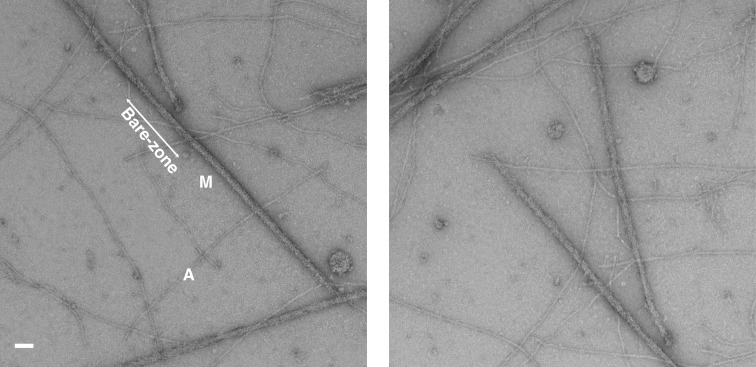
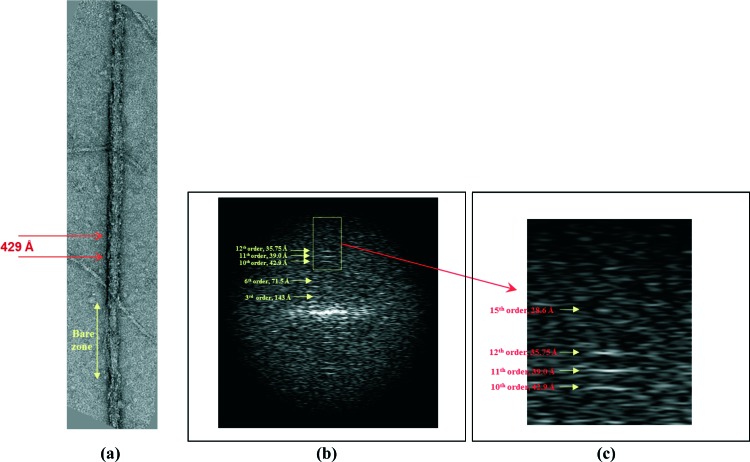
Isolation of the myosin filaments from human heart samples was done for the first time by AL-Khayat et al.24 In summary, it was performed biochemically as carefully as possible in order to preserve the filaments in their native state and to produce stable filaments under relaxing conditions throughout the procedure by homogenizing them in a relaxing solution with a high concentration of ATP (to help dissociate myosin from actin), creatine phosphate and a cocktail of five protease inhibitors [N-p-tosyl-L-phenylalanine chloromethyl ketone (TPCK), leupeptin, aprotinin, pepstatin A and trypsin inhibitor]. This inhibited the cleavage of myosin filaments into their constituent proteins. Ethylene glycol bis(β-aminoethyl ether) N,N,N′,N′-tetraacetic acid (EGTA) was also used to chelate calcium so that to prevent the attachment of the myosin heads to the actin filaments resulting in muscle contraction. Myosin filaments were then released from the heart samples by incubation in elastase solution to remove all the outer muscle membranes, and the resulting sample was then transferred to relaxing solution and centrifuged at 3000 rpm (equivalent to 735 × g) for 3 minutes in order to pellet out the debris. The resulting supernatant suspension, containing a combination of released actin and myosin filaments, was then used to make EM grids, after staining them with uranyl acetate at 2% w/v concentration, followed by performing transmission electron microscopy on these grids at room temperature. Figure 8 shows examples of two EM images of human heart myosin filaments as well as surrounding actin filaments collected at a magnification of 29,000 x. The bare zones are clearly identified (labelled in Figure 8) as well as the central M-band region of the bare zone region (red vertical stripes in the centre of the myosin filaments in Figure 3c). This gives confidence in how preserved the myosin filaments are to their native relaxed state, when they were within the muscle sarcomeres. The M-band proteins represent proteins in the centre of the myosin filament and the barezone region and they form connecting proteins linking the myosin filaments at the centre of the sarcomere.56 Small patches on the surface of the myosin filaments were also observed (arrowed in Figure 9a) which actually correspond to the myosin heads projecting out from the myosin backbone structure with an axial repeat of 429 Å. Knowledge of the pixel spacing of the 4k × 4k CCD camera used in the EM, calibrated to be 5.935 Å/pixels, enables the measurement of the spacing for the axial repeat of the myosin filament on the EM images (arrows in Figure 9a) to be 429 Å, corresponding to the axial repeat of the myosin filaments (Figure 7a).
Figure 8. .
Electron microscopy images of myosin filaments isolated from human heart muscles in the normal undiseased state and under relaxing conditions (24) taken at a magnification of 29,000x. This shows intact myosin filaments (M) with identified barezone regions with their centres. It also shows actin filaments (A) in the background. Scale bar is 2000 Å.
Figure 9. .
Computed Fourier transform of a single myosin filament from normal human heart muscle (24). (a) One single half-length myosin filaments oriented vertically with the barezone towards the bottom, showing the axial repeat of 429 Å along its length. (b) The computed Fourier transform of the half-filament shown in (a). This represents the diffraction pattern of the half-filament. The 11th order of the 429 Å repeat corresponding to 39 Å which comes from the titin sub-domain repeat, is also visible. The appearance of this reflection gives confidence in that the densities corresponding to titin would be resolved in the final 3D structure studied (see Figure 17). (c) Enlarged version for the area selected in (b) to show that there is information up to the 15th order meridional reflection of the 429 Å repeat, corresponding to 28 Å.
The filament images were first assessed in two-dimensions (2D) using not only the recorded EM images, but also by computing their Fourier transforms, which correspond to the diffraction patterns of the filaments. This was done by first selecting whole full-length myosin filaments with identified bare zones within their centres, as well as assessing their degree of order and preservation. The full-length filaments were then divided into half-filaments, which were then oriented vertically with their bare zones at the bottom, to ensure that the polarity is preserved across all the half-filaments selected for image processing and further 3D analysis. Then, for each of the individual half-filaments, the Fourier transforms were computed in order to assess the degree of structural order as well as the amount of detail/resolution of the information within them. An example of this is given in Figure 9(b), showing information up to the 15th order meridional reflection of the 429 Å repeat, corresponding to 28 Å (zoomed area shown in Figure 9c). The 11th order of the 429 Å repeat, corresponding to 39 Å, the titin sub-domain repeat, is also visible. The appearance of the 11th order gives confidence that should the half-filaments giving rise to these transforms be later subjected to 3D image analysis, then the densities corresponding to titin would eventually be resolved in the final 3D structure obtained.
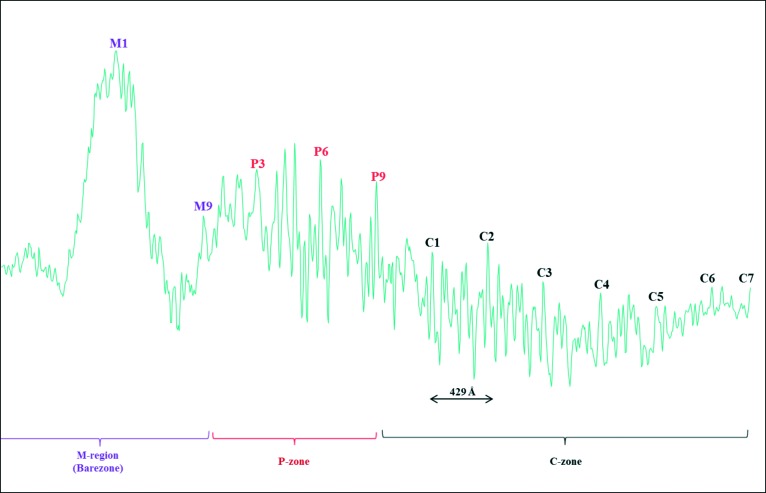
Another method to assess the preservation of the filaments, as well as to localise the positions of the myosin heads and their associated non-myosin proteins along the half-filaments, was to calculate the one-dimensional (1D) density profiles which correspond to the 1D projections of the filament images. This gives information about the variation of density, i.e. protein along the length of the filaments. An example is shown in Figure 10, which shows the 1D density profile for a total of 36 half-filaments aligned together and summed. Well-resolved peaks at a spacing of 429 Å are observed within the three main regions of the myosin filaments known as the M-region, P-zone (P stands for the proximal zone of myosin filament to the centre of the sarcomere) and the C-zone, which represents the region of the myosin filament where the MyBP-C is known to bind at seven stripes along the myosin half-filament and separated by 429 Å.8,19,67 Extra densities are also observed within the 429 Å repeats and these represent the densities attributed to the myosin heads as well as the non-myosin proteins associated with the myosin filaments, e.g. titin that is known to run along the myosin filament from the centre of the myosin filaments at the M-band where titin has its C-terminal region then through the I-band where myosin filaments are absent and to the Z-band where titin has its N-terminal region.10,68–70 Titin (also called connectin) is known to be an important non-myosin protein, a giant elastic polypeptide chain (∼3 MDa) that functions as a template for the assembly of the sarcomere during development and as a molecular spring responsible for key aspects of the mechanical behaviour of muscle.
Figure 10. .
Sum of the 1D density profiles of a total of 36 half-myosin filaments from normal human cardiac muscle, aligned together and then summed, showing peaks separated by 429 Å. The different regions within the half-myosin filament are resolved. These are the barezone (M-region), the P-zone (P stands for proximal) and C-zone (which is the region where the MyBP-C is located).
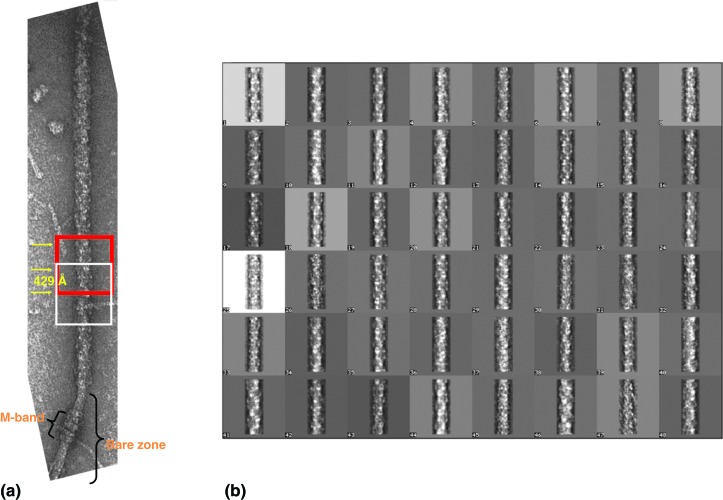
Having assessed the selected individual half-filaments, particles/segments were then selected along the vertically-oriented half-filaments (Figure 11a). These were subjected to single particle analysis (SPA) in order to determine the relative angles of views between them and calculate the overall 3D reconstruction of the myosin thick filament. This in turn allowed us to study the arrangement of the myosin heads (composed of MHC, ELC, RLC), tails [also known as Subfragment-2 (S2)] as well as the accessory proteins, titin and C-protein.
Figure 11. .
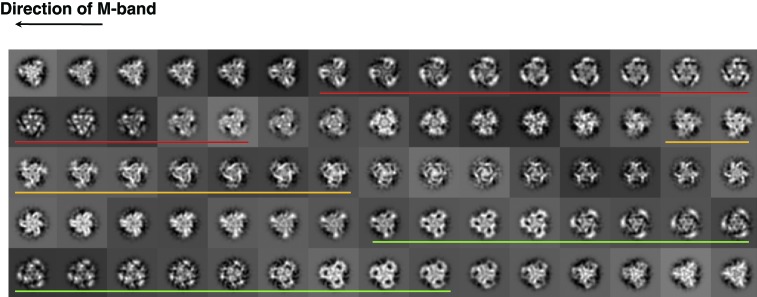
Application of single particle analysis on myosin thick filaments from human cardiac muscle. (a) Half-myosin filaments were first selected and oriented vertically with the barezone region towards the bottom, so that to preserve the polarity of all the particles selected from all the different myosin half-filaments. Particles were selected as going along the filaments and at a spacing of 429 Å. They were placed in square boxes, each of size 950 Å and were then rotationally and translationally aligned. Aligned particles were then classified into groups of similar appearance. Segments that belong to each class were then added together to produce class-averages so that to increase the signal-to-noise ratio. Each class-average is basically the same structure, but viewed in a different direction. (b) A montage of a total of 48 class-averages with each containing about 15–20 particles added together. It can be seen that the features within each class-average is different due to the different angles of views. These class-averages were then taken into the method of angular reconstitution (Figure 12) in order to calculate their corresponding angles of views.
Theory of 3D reconstruction and single particle image analysis
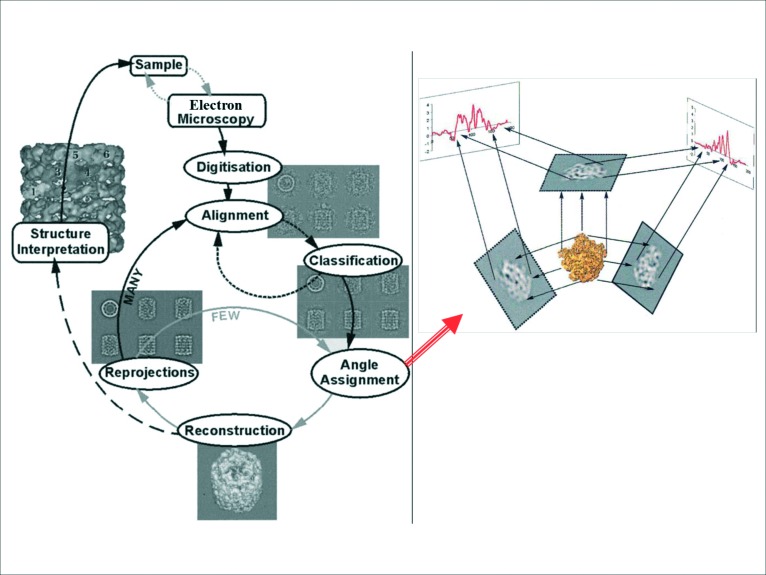
The procedure of analysing TEM data by the method of single particles using a software named IMAGIC, was originally formulated by van Heel et al.71 It was initially developed to solve the 3D structure of globular macromolecules, e.g. ribosomes, mitochondria, viruses, but not for filamentous structures. The method, summarised in the left panel of Figure 12, is based on collecting EM images of these macromolecular globular proteins, selecting particles (individual protein images), putting them within boxes of similar size to the object studied and then rotationally and translationally aligning all the particles that have similar features, and hence correspond to similar 2D views of the original protein, studied under the EM. The aligned images/views were then added together in order to enhance the signal-to-noise ratio and to later produce class-averages which correspond to the averaged sum of similar views. These class-averages were then subjected to a method called angular reconstitution, which determines the angles of views of the individual class-averages (right panel in Figure 12) using the methodology of cross-common lines and sinogram functions. Knowledge of the angles of views of each of the class-averages would then allow the user to put the class-averages back into a 3D reconstruction which represents the 3D structure of the original protein studied. Further 2D projections of the calculated 3D reconstruction are calculated in order to generate new 2D projections which are used as reference projections in order to perform more rounds of alignment of the original raw particle images and to improve their alignment, hence improving the resulting class-averages (Figure 11b). New angles of views for the new set of class-averages are then calculated, and a new 3D reconstruction is produced. In summary, this refinement procedure is repeated on average twenty to thirty times until the final calculated angles for the class-averages remain constant as well as the final calculated 3D reconstruction remaining the same.
Figure 12. .
Theory of single particle image analysis using IMAGIC software for 3D image processing (71). Left panel:- EM images are collected for particles, each in different random orientation relative to the electron beam, followed by selecting the individual particles and putting them within boxes of similar size, followed by rotational and translational alignments, classification of the aligned particles into groups of similar orientations using the multivariate statistical analysis procedure, adding up the particles which have similar features in order to produce class-averages, followed by the angular reconstitution procedure which calculates the angles of views for each of the class-averages using the theory of cross-common lines and the sinogram procedure (right panel in the Figure) and finally calculating the 3D structure by combining the class-averages and their calculated angles. New 2D re-projections are then calculated using the calculated 3D structure. These 2D-reprojections are used as a new set of reference projections in order to repeat the alignment against the original raw selected particles by the method of multiple reference alignment. Classification is then repeated in order to produce new better class-averages and a new round of angle assignment via the method of angular reconstitution is then initiated in order to improve the calculated angles of views of the class-averages followed by the calculation of a new 3D structure is calculated. This procedure is repeated a total of thirty to forty cycles until both the calculated angles remain constant as well as the 3D structure does not change in its features. This gives confidence that the correct 3D structure is finally solved. (Figure depicted from 71).
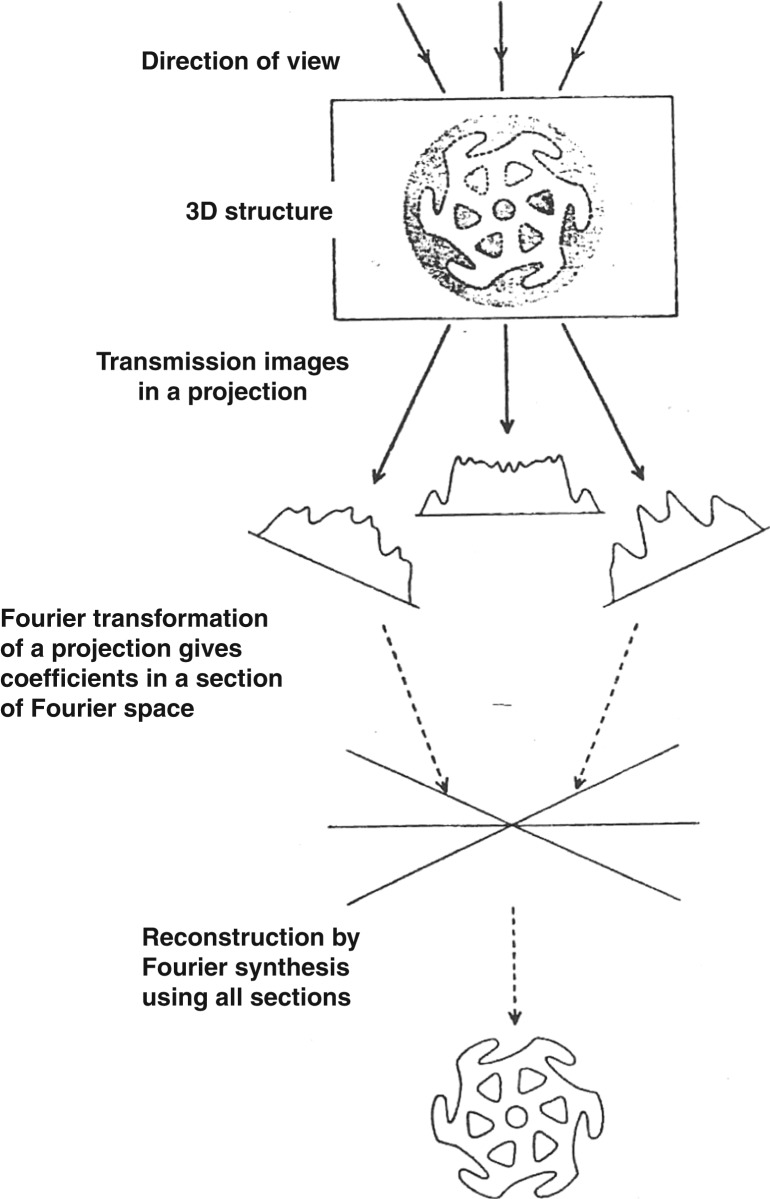
The calculation of the 3D reconstruction uses the theory of computing a 3D structure from different 2D projections.72 If we imagine we view a 3D object from different directions, we collect different 2D projections (Figure 13). Each 2D projection has a 2D Fourier transform or diffraction pattern, which essentially is a central section in the 3D Fourier transform. If we know the angle for view of each 2D projection, this therefore gives the angle for each corresponding 2D Fourier transform within the overall 3D Fourier transform in reciprocal space. By the application of Fourier synthesis on the overall 3D Fourier transform, this yields the original 3D structure. The greater the amount of 2D views/projections, the greater the number of 2D Fourier transform slices within the 3D Fourier transform and hence the higher the resolution of the 3D structure finally obtained.
Figure 13. .
The theory of 3D reconstruction of a 3D structure using 2D projections collected by transmission electron microscopy images and as formulated by DeRosier and Klug (72). Viewing a 3D structure from different directions creates a series of different 2D projections (in real space). Each 2D projection is related to the other by the direction or the angle of view and has a corresponding 2D Fourier transform (diffraction pattern in reciprocal space) which basically is a central section within the full 3D Fourier transform of the original whole 3D structure. Collecting a number of 2D projections at different view angles gives the same corresponding number of 2D Fourier transforms/slices that are also related to each other by the same angles/directions of original views. Applying Fourier synthesis on these Fourier slices in the reciprocal 3D Fourier transform and back-transform would eventually result in obtaining a 3D reconstruction of the original 3D structure in real space.
SPA uses the same principle, but instead of the 3D object being fixed and viewed from different directions, the electron beam is fixed in the electron microscope, and many copies of the same 3D object are randomly oriented on the EM grids. Similarly therefore, we are still collecting different 2D projections of the original 3D structure, with each projection related to each other by their angles of views, being the angle of the object relative to the electron beam. Each 2D projection has its own 2D Fourier transform and the different 2D transforms also are related to each other by the corresponding angles of view. The more of the different 2D projections we have at different angles and hence the more 2D transforms we have, the more we fill out the full 3D Fourier transform and this then increases the resolution by which we determine the final 3D reconstruction.
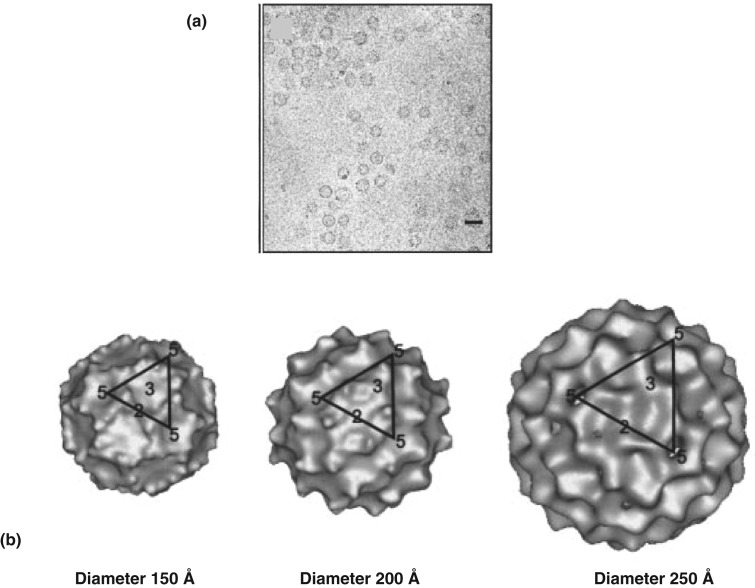
This method of SPA was previously applied on EM images of virus particles (Figure 14a) formed from Ty retrotransposons and resulted in a heterogeneous preparation of particles of different sizes (diameters 150 Å, 200 Å and 250 Å).73 It was powerful enough to produce separate class-averages corresponding to the three different sizes and led to a total of three 3D reconstructions, one for each size of virus-like particle (Figure 14b).
Figure 14. .
Application of single particle image analysis on TEM images of virus structures from yeast Ty retrotransposons (73). (a) TEM image of these virus particles showing three different sizes (scale bar 200 Å). These particles are assembled from capsid proteins with different C-terminal lengths. The small-sized capsid proteins form small-sized particles and the larger-sized capsid proteins form larger particles. (b) 3D reconstruction of the three different groups of particles with diameters 150 Å, 200 Å and 250 Å depending on the C-terminal length of the capsid protein. Each structure has an icosahedral symmetry with 5-3-2-fold rotational symmetry.
Application of single particle analysis and 3D reconstruction on myosin filaments from human heart muscles
The method recently applied by AL-Khayat et al.24 on myosin filaments isolated from human heart muscles relies on selecting segments from the vertically oriented half-filaments (Figure 11a) which can then be treated as individual particles. Particles were selected as going along the half-filaments and spaced by 429 Å. The length of each particle was just over 2 × 429 Å so that it included just over two axial repeats. Selected particles were aligned both rotationally and translationally. The final aligned particles were then classified into groups of similar appearance/feature in order to produce class-averages (Figure 11b). Each class-average is the same structure, but viewed from a different direction. The angles of views for the classes were then calculated and the classes were then put together back into a 3D reconstruction.
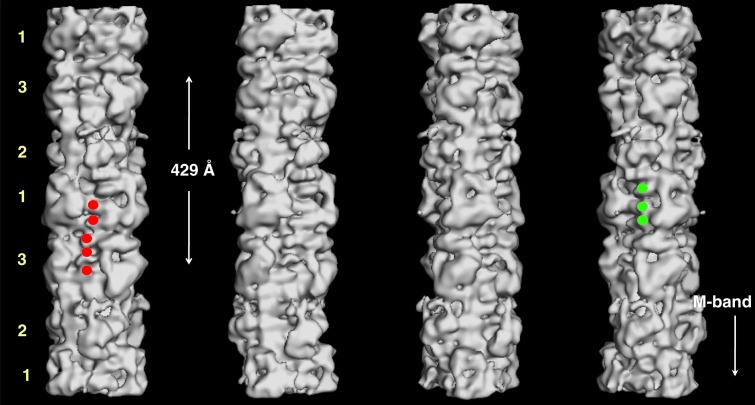
The 3D map obtained from human heart muscle (Figure 15) allowed us to interpret the structure of the myosin heads, tails, titin as well as the three C-terminal domains (C8, C9 and C10) of MyBP-C. 2D projections of the 3D reconstructions showed a total of eleven horizontal densities/stripes within the 429 Å repeat (Figure 16). This represents the densities due to the eleven domains of titin within the 429 Å repeat.
Figure 15. .
3D reconstruction of myosin filament from normal un-diseased human heart muscle under relaxing conditions (from 24), rotated by 30° around the filament long axis so that to show the different features on the surface of the filament corresponding to the myosin heads, titin and MyBP-C. Three C-terminal domains of C-protein (domains C8 to C10) next to myosin heads of level 1 (labelled by green circles in the fourth panel). To the left side of C-protein domain, another set of domain densities are observed which represent titin (five of which are labelled by red circles in the first panel). The crown level numbers are labelled. The direction of the barezone region is towards the bottom.
Figure 16. .

2D projections of the 3D map shown in Figure 15 in steps of 30˚ around the filament long axis. The yellow horizontal lines show the eleven horizontal bands within the 429 Å repeat. These correspond to the densities of the eleven domains of titin known to be located within the 429 Å repeat. The crown level numbers are labelled.
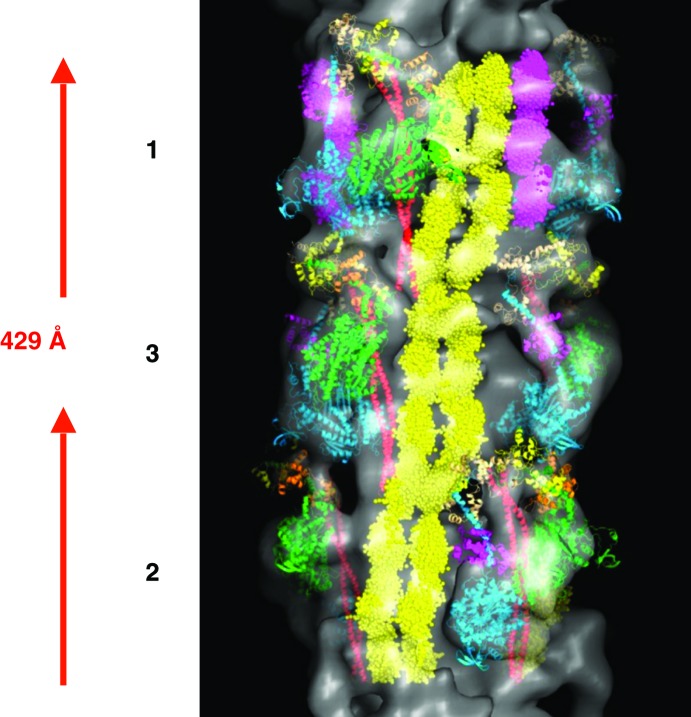
The final 3D map showed the domain structures of both C-protein and titin. Three domains of C-protein next to myosin heads of level 1 (labelled green in the fourth panel in Figure 15). These represent the C-terminus part of C-protein (domains C8 to C10). To the left side of C-protein domain, another set of domain densities are observed which represent titin (labelled red in the first panel in Figure 15). The axial separation between the domains is about 40 Å and it is therefore these domains that gave rise to the horizontal eleven stripes within the 429 Å repeat, which were also observed in the sum of the aligned particles as well as both in the class-averages (Figure 11b) and in the 2D reprojections of the 3D reconstruction (yellow horizontal lines in Figure 16). Titin is known to run all the way from Z-band (N-terminus) to M-band (C-terminus).69 Sequence analysis of titin has also shown that it has eleven copies, of eleven domains each. Each of these eleven domains are observed within a 429 Å repeat.70 Therefore, the eleven stripes within the 429 Å repeat that were observed in the 3D reconstruction, actually come from titin and they represent the eleven domains of titin within the 429 Å repeat (yellow in Figure 17).24 There are six longitudinal strands/molecules of titin running along the surface of each half of a myosin filament with two titin strands/molecules associated with one molecule of C-protein, per 429 Å axial repeat. The 3D reconstruction (Figure 17) showed domains densities which are double the width of C-protein domains and therefore these domains actually represent the domains of the two titin strands (see Movie 2 of supplementary information of AL-Khayat et al.24).
Figure 17. .
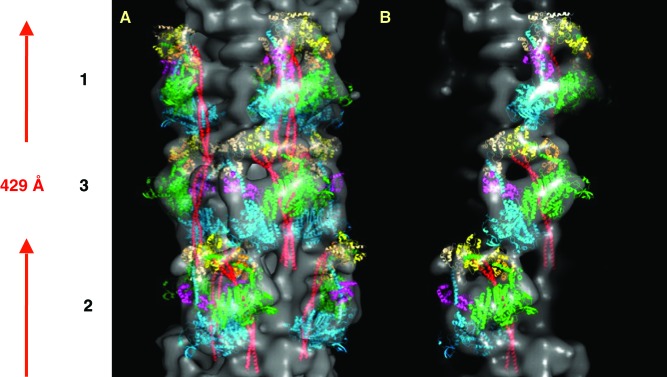
The final 3D reconstruction of the human heart muscle myosin filament for one full 429 Å repeat (Figure 15) along with the fitted myosin heads (shown in green, orange, yellow, cyan, magenta, beige), S2 (shown in red), the two strands of titin (shown in yellow) and the MyBP-C (shown in purple). This represents the atomic model for the myosin thick filament from normal un-diseased human heart muscle in the relaxed state. The crown level numbers are labelled.
Analysis of individual slices through the 3D reconstruction (Figure 18) viewed perpendicular to the filament axis at every 5.935 Å spacing and looking towards M-band showed how the angles varies between the individual slices as well as showing the details in both the regions where the outer myosin heads are, and within the central backbone regions (for more information, see AL-Khayat et al.24).
Figure 18. .
2D cross-sectional slices through one 429 Å repeat of the 3D map shown in Figure 15, each viewed toward the M-band barezone region, at every 5.935 Å spacing along the length of the map. Top left slice is towards the bottom part of 3D map (i.e. towards the M-band). Red line corresponds to slices for crown level 1; yellow line: slices for level 2; green line: slices for level 3.
Future work – structural implications of mutations that cause human cardiomyopathies
Studying the 3D structure of myosin thick filaments in the relaxed state of any muscle is essential, as it represents the first state in the crossbridge force-generating cycle of muscle contraction, which allows us to understand how muscle contraction is initiated. Moreover, studying the myosin thick filament 3D structure from human cardiac muscle in the normal undiseased state and under relaxing conditions, is an essential starting point from which to understand the molecular mechanisms of the diseased system. Of particular interest is the effect of mutations in myosin heavy chains, myosin light chains, the accessory proteins, such as titin and MyBP-C and their association with different human cardiomyopathies, as well as how these mutations affect muscle function and contraction.
Recently AL-Khayat et al.24 determined, for the first time, the 3D reconstruction of relaxed myosin filaments from human heart muscle by isolating the myosin filaments under relaxing conditions, performing negatively stained TEM and then applying single particle 3D image analysis (Figures 15, 17 & 19). It was found that the myosin heads densities on the reconstructed crown levels could be fitted quite well using the atomic models of the myosin heads crystal structures (Figure 19).34,74 It was also possible to define densities attributed to the domains of both titin and MyBP-C (Figure 17). This structure represented the highest resolution 3D reconstruction from any vertebrate striated myosin thick filament structure in the relaxed state of the muscle, and more importantly it was the first time that a 3D reconstruction for myosin filament was solved from a medically relevant specimen of normal human heart muscle. It therefore serves as an important starting point from which to understand the effects of the mutations in myosin, titin and C-protein (MyBP-C) associated with different human cardiomyopathies.
Figure 19. .
Fitting the atomic crystal structures for the myosin heads and S2 into the final 3D reconstruction of myosin filament from normal human heart muscle for one full 429 Å repeat (Figure 15). The crown level numbers are labelled. Red is the S2; green, orange and yellow are the myosin heavy chain, essential and regulatory light chains for the blocked head, respectively; cyan, magenta and beige are the myosin heavy chain, essential and regulatory light chains for the free head, respectively. The docking of the atomic crystal structures allows us to study the intra- and inter-molecular interactions between the myosin molecules on the different crown levels.
Until now, no 3D structure of a cardiac muscle myosin filament from human cardiomyopathic samples has been published. Future work will therefore concentrate on the application of isolating myosin filaments from human cardiomyopathic samples with known mutations in myosin filaments and performing transmission electron microscopy, followed by single particle 3D image analysis procedures in order to reconstruct for the first time the 3D structure of a mutated myosin filament.
There a several types of mutations; some are mis-sense mutations that cause single amino acid substitutions, some are insertions or deletions causing reading frame shifts, nonsense mutations introducing premature termination codons (ter), splices site donor/acceptor mutations and finally in-frame insertions or deletions. It is postulated that each of these mutations would cause a change in the surface charge of the mutated amino acid(s) and this in turn will change the interactions of the mutated amino acid(s) with the rest of the neighbouring amino acids within the head structure as well as with the surrounding heads on the filament backbone surface, or even with the surrounding actin, tropomyosin, troponin complexes within the A-band region of the sarcomere. The effect of the mutations would also change the overall conformation of the local region of the head structure close to the mutated amino acid(s), and might induce some weaker interactions with the surrounding amino acids, leading to flexibility within the overall structure of the head, and hence more possible interactions with the surrounding actin filaments. This could explain why some of the observed mutations have been shown to lead to enhanced contractility giving rise to disease symptoms that involve energy compromise in HCM. In contrary, there could be some mutations that would do the opposite and lead to stronger interactions and possibly tight binding of proteins together.
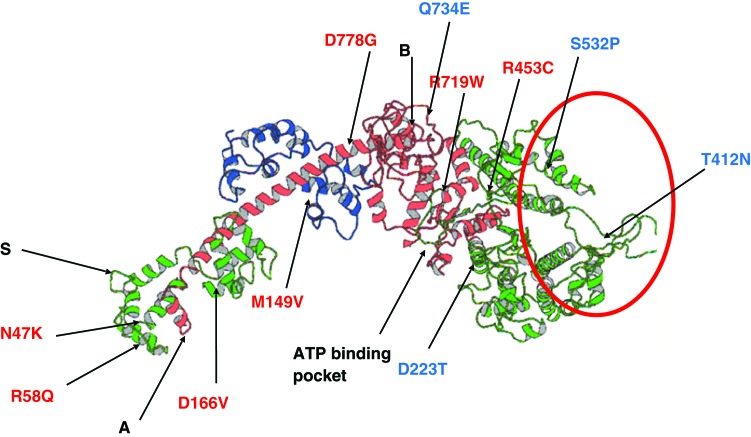
Figure 20 shows a selection of known mis-sense mutations in the ELC, RLC and the MHC of the myosin heads that cause HCM (shown in red letters in Figure 20) or DCM (showed in blue letters in Figure 20). Each of these mutations could cause a different structural confirmation in the myosin head and this would have an impact on the way that the head will interact with the surrounding actin filaments, which possibly affect the force produced and ultimately the observed effect of the disease. It is anticipated that mutations in the C-terminal part of the MHC within the myosin head, next to the point where it contacts the rod part of the myosin molecules (labelled A in Figure 20), could have an effect on the hinging flexibility of the whole head (i.e. motor domain and lever arm) about the rod. Mutations in the N-terminal part of the MHC, within the motor domain of the myosin head (circled in red in Figure 20), could have a direct effect on the interaction with the surrounding actin filaments, due to the fact that the main actin binding sites lie in that part of the head. However, mutations within the amino acids linking the motor domain to the lever arm of the myosin head (labelled B in Figure 20) could have a direct impact on the way the motor domain will move relative to the lever arm upon binding to actin. Since the ELC and RLC are bound to the lever arm part of the head, it is expected that mutations within both the ELC and RLC would affect this binding and hence would have an impact on the hinging action of the lever arm during muscle contraction. Moreover, the RLC has a phosphorylation site, being the serine amino acid number 15 in the human RLC (labelled S in Figure 20) and any mutation within this site will affect the phosphorylation by Protein kinase A (PKA) as well as the mechanism of regulation. Some mutations within the phosphorylation sites could result in the up or down regulation of muscle contraction, depending on what amino acid mutations they are.
Figure 20. .
A selection of known missense mutations in the ELC, RLC and the MHC of the myosin heads that cause HCM or DCM (66, Harris et al. 2011). The colour scheme for the ELC, RLC and the MHC is as shown in Figure 4a. Mutations causing HCM are shown in red letters whereas those causing DCM are showed in blue letters. The C-terminal part of the MHC within the myosin head next to the point where it contacts the rod part of the myosin molecules is labelled A. The amino acids involved in binding to actin lie in the N-terminal part of the MHC within the motor domain of the myosin head and are circled in red. The amino acids linking the motor domain to the lever arm of the myosin head are near the region labelled B. The phosphorylation site in the RLC at serine amino acid number 15 is labelled S. The ATP binding site where myosin activators might bind is labelled.
Certain mutations affect the rod part of the myosin molecule and this could have crucial implications on the packing arrangement of the rods within the filament backbone. Since the myosin heads project from the tip of the rods and arrange in a three-stranded quasi-helical fashion around the filament backbone, any miss-arrangement of the rods would ultimately have an effect on the overall way the myosin heads are arranged on the surface of the backbone and in return this will have an effect on the interaction of the heads with the surrounding actin filaments within the sarcomere. Mutations within the myosin rods could also have implications on the stability of the filament overall and its interaction with the backbone proteins, titin and MyBP-C. It is also likely that they will have an effect on the overall transmission of the force along the myosin filament itself.
With regards to mutations within MyBP-C, it has been reported that there are many types of mutations in any of the eleven domains (C0-C10) of cardiac MyBP-C that could cause either HCM or DCM. Surely, each of these will have an effect on the structure of the overall MyBP-C, and mutations within its phosphorylation site between domains C1 and C2 will have an effect on the binding of PKA, affecting the way that MyPB-C regulates the myosin-actin interaction.
It is therefore important that when cardiomyopathic mutations within the ELC, RLC, MHC, MyBP-C, titin or the rod part of the myosin molecule are studied, that each mutation is considered one at a time in detail after the corresponding overall 3D structure of the mutated myosin filament is determined. It is also essential to relate the final structural findings with the known normal 3D structure24 as well as with the function of the mutated muscle and patient's symptoms. This would eventually lead to more accurate postulations as to how the change in structure can cause the disease process and the observed patients' symptoms.
Recently there has been interest in the use of pharmacologic agents, cardiac myosin activators, as a treatment in the left ventricular systolic heart failure, e.g. Omecamtiv mecarbil. These have been shown to target the kinetics of the myosin heads by activating the myocardial ATPase. In vitro studies have demonstrated that these agents increase the rate of effective myosin interaction with actin and increase the duration and amount of myocyte contraction, as well as inhibit non-productive consumption of ATP. They therefore potentially improve the myocyte energy utilization and myocardial efficiency.75,76 It is anticipated that these drugs bind to the ATP binding site (labelled as ATP binding pocket in Figure 20) and possibly have an effect on the speed with which the cleft of ATP binding site is closed when ATP is bound to the myosin heads and then hydrolysed into ADP and Pi (Figure 2), followed by the release of the products and the transition from weak to strong binding. Of course, precise structural answers can only be obtained when the 3D structure of these myosin activators while bound to the myosin heads is solved by the method of 3D EM and single particle analysis. This would definitely have a direct impact on future drug design.
The application of 4D electron microscopy77–79 can also be utilized to study the dynamics of myosin filaments by capturing EM images of isolated myosin filaments from normal undiseased human heart samples in order to determine how the structure changes as a function of time. Of particular interest is the time after it is isolated from the muscle fibres and the ATP then begins to be depleted from the muscle sample. This would allow us to study how the 3D structure of myosin filament changes as the ATP concentration is reduced with time, as the two sets of myosin and actin filaments start to bind together.
Repeating the same type of analysis of 4D EM on isolated mutated myosin thick filaments would further allow us to perform a direct comparison with the results obtained from the normal myosin filaments. This would definitely be a breakthrough in understanding not only how myosin thick filaments are switched on in order to reach the activation stage and go through the cycle from the relaxed state to the active state and binding to the neighbouring actin filaments, but also to understand how the different mutations in myosin filaments could affect the crossbridge cycle of muscle contraction. This would also lead us to understand the molecular changes in the cardiomyopathic samples and the effects of the mutations on the function of the muscle contraction. In addition, we can understand the disease process by directly correlating the EM structural results with both the observed symptoms from patients and their clinical cardiac outputs.
The field of muscle research would definitely enter an exciting phase upon the application of 4D EM and studying the variation of the myosin filament 3D structure as a function of time during muscle contraction. This approach could also help in understanding how certain mutations alter the function of the filaments and how this leads to disease and to the symptoms observed. Of course, it is envisaged that this type of work would require very significant EM and computing power. This is certainly achievable, given the huge advances currently taking place in both the efficiency of EM machines and in the use of supercomputers.
Understanding both the molecular and the atomic basis of human cardiomyopathies would make a tremendous contribution towards designing future therapeutic interventions for heart patients and relieving their pain and symptoms, which ultimately is the aim of any medical research; to focus on the development of knowledge which can translate to improved patients treatments, and relief of suffering and disease.
References
- 1.Huxley AF, Niedergerke R. Structural changes in muscle during contraction; interference microscopy of living muscle fibres. Nature. 1954;173(4412):971–973. doi: 10.1038/173971a0. [DOI] [PubMed] [Google Scholar]
- 2.Huxley HE, Hanson J. Changes in the cross-striations of muscle during contraction and stretch and their structural interpretation. Nature. 1954;173(4412):973–976. doi: 10.1038/173973a0. [DOI] [PubMed] [Google Scholar]
- 3.Huxley HE. The mechanism of muscular contraction. Science. 1969;164(3886):1356–1365. doi: 10.1126/science.164.3886.1356. [DOI] [PubMed] [Google Scholar]
- 4.Rayment I, Rypniewski WR, Schmidt-Base K, Smith R, Tomchick DR, Benning MM, Winkelmann DA, Wesenberg G, Holden HM. Three-dimensional structure of myosin subfragment-1: a molecular motor. Science. 1993;261:50–58. doi: 10.1126/science.8316857. [DOI] [PubMed] [Google Scholar]
- 5.Dominguez R, Freyzon Y, Trybus KM, Cohen C. Crystal structure of a vertebrate smooth muscle myosin motor domain and its complex with the essential light chain: visualization of the pre- power stroke state. Cell. 1998;94:559–571. doi: 10.1016/s0092-8674(00)81598-6. [DOI] [PubMed] [Google Scholar]
- 6.AL-Khayat HA, Hudson L, Reedy MK, Irving TC, Squire JM. Myosin head configuration in relaxed insect flight muscle: X-ray modelled resting cross-bridges in a pre-powerstroke state are poised for actin binding. Biophys J. 2003;85(2):1063–1079. doi: 10.1016/S0006-3495(03)74545-7. [DOI] [PMC free article] [PubMed] [Google Scholar]
- 7.Houdusse A, Szent-Gyorgyi AG, Cohen C. Three conformational states of scallop myosin S1. Proc Natl Acad Sci USA. 2000;97:11238–11243. doi: 10.1073/pnas.200376897. [DOI] [PMC free article] [PubMed] [Google Scholar]
- 8.Offer G, Moos C, Starr R. A new protein of the thick filaments of vertebrate skeletal myofibrils: extraction, purification and characterisation. J Mol Biol. 1973;74(4):653–676. doi: 10.1016/0022-2836(73)90055-7. [DOI] [PubMed] [Google Scholar]
- 9.Labeit S, Kolmerer B. Titins: giant proteins in charge of muscle ultrastructure and elasticity. Science. 1995;270:293–296. doi: 10.1126/science.270.5234.293. [DOI] [PubMed] [Google Scholar]
- 10.Trinick J. Cytoskeleton - titin as a scaffold and a spring. Curr Biol. 1996;6:258–260. doi: 10.1016/s0960-9822(02)00472-4. [DOI] [PubMed] [Google Scholar]
- 11.Lehman W, Galinska-Rakoczy A, Hatch V, Tobacman LS, Craig R. Structural basis for the activation of muscle contraction by troponin and tropomyosin. J Mol Biol. 2009;388(4):673–681. doi: 10.1016/j.jmb.2009.03.060. [DOI] [PMC free article] [PubMed] [Google Scholar]
- 12.Cammarato A, Craig R, Lehman W. Electron microscopy and three-dimensional reconstruction of native thin filaments reveal species-specific differences in regulatory strand densities. Biochem Biophys Res Commun. 2010;391(1):193–197. doi: 10.1016/j.bbrc.2009.11.030. [DOI] [PMC free article] [PubMed] [Google Scholar]
- 13.Kabsch W, Mannherz HG, Suck D, Pai EF, Holmes KC. Atomic structure of the actin:DNase I complex. Nature. 1990;347(6288):37–44. doi: 10.1038/347037a0. [DOI] [PubMed] [Google Scholar]
- 14.Holmes KC, Popp D, Gebhard W, Kabsch W. Atomic model of the actin filament. Nature. 1990;347(6288):44–49. doi: 10.1038/347044a0. [DOI] [PubMed] [Google Scholar]
- 15.Oda T, Iwasa M, Aihara T, Maeda Y, Narita A. The nature of the globular- to fibrous-actin transition. Nature. 2009;457:441–445. doi: 10.1038/nature07685. [DOI] [PubMed] [Google Scholar]
- 16.Fujii T, Iwane AH, Yanagida T, Namba K. Direct visualization of secondary structures of F-actin by electron cryomicroscopy. Nature. 2010;467:724–729. doi: 10.1038/nature09372. [DOI] [PubMed] [Google Scholar]
- 17.Li XE, Holmes KC, Lehman W, Jung H, Fischer S. The shape and flexibility of tropomyosin coiled coils: implications for actin filament assembly and regulation. J Mol Biol. 2010;395(2):327–329. doi: 10.1016/j.jmb.2009.10.060. [DOI] [PubMed] [Google Scholar]
- 18.Takeda S, Yamashita A, Maeda K, Maeda Y. Structure of the core domain of human cardiac troponin in the Ca2+-saturated form. Nature. 2003;424:35–41. doi: 10.1038/nature01780. [DOI] [PubMed] [Google Scholar]
- 19.Squire JM, AL-Khayat HA, Knupp C, Luther PK. 3D molecular architecture of muscle. Adv Protein Chem. 2005;71:17–87. doi: 10.1016/S0065-3233(04)71002-5. [DOI] [PubMed] [Google Scholar]
- 20.Squire JM. Muscle myosin filaments: cores, crowns and couplings. Biophys Rev. 2009;1:149–160. doi: 10.1007/s12551-009-0017-4. [DOI] [PMC free article] [PubMed] [Google Scholar]
- 21.Craig R. Isolation, electron microscopy and 3D reconstruction of invertebrate muscle myofilaments. Methods. 2012;56:33–43. doi: 10.1016/j.ymeth.2011.11.007. [DOI] [PMC free article] [PubMed] [Google Scholar]
- 22.AL-Khayat HA, Morris EP, Kensler RW, Squire JM. 3D structure of fish muscle myosin filaments by single particle analysis. J Struct Biol. 2006;155:202–217. doi: 10.1016/j.jsb.2006.01.014. [DOI] [PubMed] [Google Scholar]
- 23.AL-Khayat HA, Morris EP, Kensler RW, Squire JM. Myosin filament 3D structure in mammalian cardiac muscle. J Struct Biol. 2008;163(2):117–126. doi: 10.1016/j.jsb.2008.03.011. [DOI] [PMC free article] [PubMed] [Google Scholar]
- 24.AL-Khayat HA, Kensler RW, Squire JM, Marston SB, Morris EP. Atomic model of the human cardiac myosin filament. Proc Natl Acad Sci USA. 2013;110(1):318–323. doi: 10.1073/pnas.1212708110. [DOI] [PMC free article] [PubMed] [Google Scholar]
- 25.Zoghbi ME, Woodhead JL, Moss RL, Craig R. Three-dimensional structure of vertebrate cardiac muscle myosin filaments. Proc Natl Acad Sci USA. 2008;105(7):2386–2390. doi: 10.1073/pnas.0708912105. [DOI] [PMC free article] [PubMed] [Google Scholar]
- 26.Kensler RW. The mammalian cardiac muscle thick filament: crossbridge arrangement. J Struct Biol. 2005;149(3):303–331. doi: 10.1016/j.jsb.2004.12.003. [DOI] [PubMed] [Google Scholar]
- 27.Kensler RW, Stewart M. Frog skeletal muscle thick filaments are three-stranded. J Cell Biol. 1983;96:1797–1802. doi: 10.1083/jcb.96.6.1797. [DOI] [PMC free article] [PubMed] [Google Scholar]
- 28.Kensler RW, Stewart M. An ultrastructural study of cross-bridge arrangement in the frog thigh muscle thick filament. Biophys J. 1986;49(1):343–351. doi: 10.1016/S0006-3495(86)83647-5. [DOI] [PMC free article] [PubMed] [Google Scholar]
- 29.Kensler RW, Stewart M. An ultrastructural study of the cross-bridge arrangement in the fish skeletal muscle thick filament. J Cell Sci. 1989;94:391–401. doi: 10.1242/jcs.94.3.391. [DOI] [PubMed] [Google Scholar]
- 30.Huxley HE, Brown W. The low-angle X-ray diagram of vertebrate striated muscle and its behaviour during contraction and rigor. J Mol Biol. 1967;30:383–434. doi: 10.1016/s0022-2836(67)80046-9. [DOI] [PubMed] [Google Scholar]
- 31.Morris EP, Squire JM, Fuller GW. The 4-stranded helical arrangement of myosin heads on insect (Lethocerus) flight muscle thick filaments. J Struct Biol. 1991;107:237–249. [Google Scholar]
- 32.Stewart M, Kensler RW, Levine RJ. Three-dimensional reconstruction of thick filaments from Limulus and scorpion muscle. J Cell Biol. 1985;101:402–411. doi: 10.1083/jcb.101.2.402. [DOI] [PMC free article] [PubMed] [Google Scholar]
- 33.Woodhead JL, Zhao F-Q, Craig R, Egelman EH, Alamo L, Padron R. Atomic model of a myosin filament in the relaxed state. Nature. 2005;436:1195–1199. doi: 10.1038/nature03920. [DOI] [PubMed] [Google Scholar]
- 34.Alamo L, Wriggers W, Pinto A, Bartoli F, Salazar L, Zhao FQ, Craig R, Padron R. Three-dimensional reconstruction of tarantula myosin filaments suggests how phosphorylation may regulate myosin activity. J Mol Biol. 2008;384(4):780–797. doi: 10.1016/j.jmb.2008.10.013. [DOI] [PMC free article] [PubMed] [Google Scholar]
- 35.Zhao F-Q, Craig R, Woodhead JL. Head-head interaction characterizes the relaxed state of Limulus muscle myosin filaments. J Mol Biol. 2009;385:423–431. doi: 10.1016/j.jmb.2008.10.038. [DOI] [PMC free article] [PubMed] [Google Scholar]
- 36.Harrington WF, Rodgers ME. Myosin. Ann Rev Biochem. 1984;53:35–73. doi: 10.1146/annurev.bi.53.070184.000343. [DOI] [PubMed] [Google Scholar]
- 37.Squire JM, Luther PK, Morris EP.Organisation and properties of the striated muscle sarcomere Squire JM, ed. Molecular Mechanisms in Muscular Contraction Vol. 1319901–48. [Google Scholar]
- 38.Vibert P, Craig R. Electron microscopy and image analysis of myosin filaments from scallop striated muscles. J Mol Biol. 1983;165(2):303–320. doi: 10.1016/s0022-2836(83)80259-9. [DOI] [PubMed] [Google Scholar]
- 39.Vibert P. Helical reconstruction of frozen-hydrated scallop myosin filaments. J Mol Biol. 1992;223:661–671. doi: 10.1016/0022-2836(92)90982-p. [DOI] [PubMed] [Google Scholar]
- 40.AL-Khayat HA, Morris EP, Squire JM. The 7-stranded structure of relaxed scallop muscle myosin filaments: support for a common theme of regulation in myosin-regulated muscles. J Struct Biol. 2009;166(2):183–194. doi: 10.1016/j.jsb.2009.02.006. [DOI] [PubMed] [Google Scholar]
- 41.Woodhead JL, Zhao F-Q, Craig R. Structural basis of the relaxed state of a Ca2+-regulated myosin filament and its evolutionary implications. Proc Natl Acad Sci USA. 2013;110(21):8561–8566. doi: 10.1073/pnas.1218462110. [DOI] [PMC free article] [PubMed] [Google Scholar]
- 42.Crowther RA, Padron R, Craig R. Arrangement of the heads of myosin in relaxed thick filaments from tarantula muscle. J Mol Biol. 1985;184:429–439. doi: 10.1016/0022-2836(85)90292-x. [DOI] [PubMed] [Google Scholar]
- 43.Offer G, Knight PJ, Burgess SA, Alamo L, Padron R. A new model for the surface arrangement of myosin molecules in tarantula thick filaments. J Mol Biol. 2000;298:239–260. doi: 10.1006/jmbi.2000.3664. [DOI] [PubMed] [Google Scholar]
- 44.Houdusse A, Kalabokis VN, Himmel D, Szent-Gyorgyi AG, Cohen C. Atomic structure of scallop myosin subfragment S1 complexed with MgADP: a novel conformation of the myosin head. Cell. 1999;97:459–470. doi: 10.1016/s0092-8674(00)80756-4. [DOI] [PubMed] [Google Scholar]
- 45.Houdusse A, Sweeney HL. Myosin motors: missing structures and hidden springs. Curr Opin Struc Biol. 2001;11:182–194. doi: 10.1016/s0959-440x(00)00188-3. [DOI] [PubMed] [Google Scholar]
- 46.Irving M, Allen TS, Sabidodavid C, Craik JS, Brandmeier B, Kendrick- Jones J, Corrie JET, Trentham DR, Goldman YE. Tilting of the light chain region of myosin during step length changes and active force generation in skeletal muscle. Nature. 1995;375:688–691. doi: 10.1038/375688a0. [DOI] [PubMed] [Google Scholar]
- 47.Uyeda T, Abramson PD, Spudich JA. The neck region of the myosin motor domain acts as a lever arm to generate movement. Proc Natl Sci USA. 1996;93(9):4459–4464. doi: 10.1073/pnas.93.9.4459. [DOI] [PMC free article] [PubMed] [Google Scholar]
- 48.Holmes KC. The swinging lever-arm hypothesis of muscle contraction. Curr Biol. 1997;7:R112–R188. doi: 10.1016/s0960-9822(06)00051-0. [DOI] [PubMed] [Google Scholar]
- 49.Geeves MA, Holmes KC. The molecular mechanism of muscle contraction. Adv Protein Chem. 2005;71:161–193. doi: 10.1016/S0065-3233(04)71005-0. [DOI] [PubMed] [Google Scholar]
- 50.Kensler RW, Stewart M. The relaxed crossbridge pattern in isolated rabbit psoas muscle thick filaments. J Cell Sci. 1993;105:841–848. doi: 10.1242/jcs.105.3.841. [DOI] [PubMed] [Google Scholar]
- 51.Stewart M, Kensler RW. Arrangement of myosin heads in relaxed thick filaments from frog skeletal muscle. J Mol Biol. 1986;192:831–851. doi: 10.1016/0022-2836(86)90032-x. [DOI] [PubMed] [Google Scholar]
- 52.Kensler RW, Woodhead JL. The chicken muscle thick filament: temperature and the relaxed crossbridge arrangement. J Musc Res Cell Motil. 1995;16:79–90. doi: 10.1007/BF00125312. [DOI] [PubMed] [Google Scholar]
- 53.Eakins F, AL-Khayat HA, Morris EP, Kensler RW, Squire JM. 3D structure of fish muscle myosin filaments. J Struct Biol. 2002;137:154–163. doi: 10.1006/jsbi.2002.4453. [DOI] [PubMed] [Google Scholar]
- 54.Kensler RW, Harris SP. The structure of isolated cardiac myosin thick filaments from cardiac myosin binding protein-C knockout mice. Biophys J. 2008;94:1797–1802. doi: 10.1529/biophysj.107.115899. [DOI] [PMC free article] [PubMed] [Google Scholar]
- 55.AL-Khayat HA, Morris EP, Squire JM. Single Particle Analysis: a new approach to solving the 3D structure of Myosin Filaments. Rev J Musc Res Cell Motil. 2004;25(8):635–644. doi: 10.1007/s10974-004-5333-5. [DOI] [PubMed] [Google Scholar]
- 56.AL-Khayat HA, Kensler RW, Morris EP, Squire JM. Three-Dimensional structure of the M-region (barezone) of vertebrate striated muscle myosin filaments by single particle analysis. J Mol Biol. 2010;403(5):763–776. doi: 10.1016/j.jmb.2010.09.025. [DOI] [PMC free article] [PubMed] [Google Scholar]
- 57.AL-Khayat HA, Kensler RW, Squire JM, Marston SB, Morris EP. Three-dimensional structure of human cardiac muscle myosin filaments by electron microscopy and single particle analysis. Biophys J. 2012;102(3):149a–150a. [Google Scholar]
- 58.Watkins H, Rosenzweig A, Hwang D-S, Levi T, McKenna WJ, Seidman CE, Seidman JG. Characteristics and prognostic implications of myosin missense mutations in familial hypertrophic cardiomyopathy. N Engl J Med. 1992;326:1108–1114. doi: 10.1056/NEJM199204233261703. [DOI] [PubMed] [Google Scholar]
- 59.Watkins H, Conner D, Thierfelder L, Jarcho JA, MacRae C, McKenna WJ, Maron BJ, Seidman JG, Seidman CE. Mutations in the cardiac myosin binding protein-C gene on chromosome 11 cause familial hypertrophic cardiomyopathy. Nat Gene. 1995;11:434–437. doi: 10.1038/ng1295-434. [DOI] [PubMed] [Google Scholar]
- 60.Richard P, Charron P, Carrier L, Ledeuil C, Cheav T, Pichereau C, Benaiche A, Isnard R, Dubourg O, Burban M, Gueffet JP, Millaire A, Desnos M, Schwartz K, Hainque B, Komajda M. Hypertrophic cardiomyopathy distribution of disease genes, spectrum of mutations and implications for a molecular diagnosis strategy. Circulation. 2003;107(17):2227–2232. doi: 10.1161/01.CIR.0000066323.15244.54. [DOI] [PubMed] [Google Scholar]
- 61.Seidman JG, Seidman CE. The genetic basis for cardiomyopathy: from mutation identification to mechanistic paradigms. Cell. 2001;104:557–567. doi: 10.1016/s0092-8674(01)00242-2. [DOI] [PubMed] [Google Scholar]
- 62.Seidman CE, Seidman JG. Identifying sarcomere gene mutations in hypertrophic cardiomyopathy: a personal history. Circ Res. 2011;108(6):743–750. doi: 10.1161/CIRCRESAHA.110.223834. [DOI] [PMC free article] [PubMed] [Google Scholar]
- 63.Tajsharghi H, Thornell LE, Lindberg C, Lindvall B, Henriksson KG, Oldfors A. Myosin storage myopathy associated with a heterozygous missense mutation in MYH7. Ann Neurol. 2003;54:494–500. doi: 10.1002/ana.10693. [DOI] [PubMed] [Google Scholar]
- 64.Tajsharghi H. Thick and thin filament gene mutations in striated muscle diseases. Int J Mol Sci. 2008;9:1259–1275. doi: 10.3390/ijms9071259. [DOI] [PMC free article] [PubMed] [Google Scholar]
- 65.Morimoto S. Sarcomeric proteins and inherited cardiomyopathies. Cardiovasc Res. 2008;77:659–666. doi: 10.1093/cvr/cvm084. [DOI] [PubMed] [Google Scholar]
- 66.Marston S. How do mutations in contractile proteins cause the primary familial cardiomyopathies. J Cardiovasc Trans Res. 2011;4:245–255. doi: 10.1007/s12265-011-9266-2. [DOI] [PubMed] [Google Scholar]
- 67.Bennett P, Craig R, Starr R, Offer G. The ultrastructural location of C-protein, X-protein and H-protein in rabbit muscle. J Musc Res Cell Motil. 1986;7(6):550–567. doi: 10.1007/BF01753571. [DOI] [PubMed] [Google Scholar]
- 68.LeWinter MM, Granzier H. Cardiac titin: a multifunctional giant. Circulation. 2010;121(19):2137–2145. doi: 10.1161/CIRCULATIONAHA.109.860171. [DOI] [PMC free article] [PubMed] [Google Scholar]
- 69.Liversage AD, Holmes D, Knight PJ, Tskhovrebova L, Trinick J. Titin and the sarcomere symmetry paradox. J Mol Biol. 2001;305(3):401–409. doi: 10.1006/jmbi.2000.4279. [DOI] [PubMed] [Google Scholar]
- 70.Tskhovrebova L, Trinick J. Roles of titin in the structure and elasticity of the sarcomere. J Biomed Biotechnol. 2010 doi: 10.1155/2010/612482. article 612482. [DOI] [PMC free article] [PubMed] [Google Scholar]
- 71.van Heel M, Gowen B, Matadeen R, Orlova EV, Finn R, Pape T, Cohen D, Stark H, Schmidt R, Schatz M, Patwardhan A. Single-particle electron cryo-microscopy: towards atomic resolution. Quart Rev Biophys. 2000;33:307–369. doi: 10.1017/s0033583500003644. [DOI] [PubMed] [Google Scholar]
- 72.De Rosier DJ, Klug A. Reconstruction of three dimensional structures from electron micrographs. Nature. 1968;217(5124):130–134. doi: 10.1038/217130a0. [DOI] [PubMed] [Google Scholar]
- 73.AL-Khayat HA, Bhella D, Kenney JM, Roth J-F, Kingsman AJ, Martin-Rendon E, Saibil HR. Yeast Ty Retrotransposons assemble into virus-like particles whose T-numbers depend on the C-terminal length of the capsid protein. J Mol Biol. 1999;292(1):65–73. doi: 10.1006/jmbi.1999.3055. [DOI] [PubMed] [Google Scholar]
- 74.Wendt T, Taylor D, Trybus KM, Taylor K. Three-dimensional image reconstruction of dephosphorylated smooth muscle heavy meromyosin reveals asymmetry in the interaction between myosin heads and placement of subfragment 2. Proc Natl Acad Sci USA. 2001;98:4361–4366. doi: 10.1073/pnas.071051098. [DOI] [PMC free article] [PubMed] [Google Scholar]
- 75.Malik F, Teerlik J, Escandon R, Clarke C, Wolfe A. The selective cardiac myosin activator, CK1827452, a calcium-independent inotrope, increases left ventricular systolic function by increasing ejection time rather than the velocity of contraction. Circulation. 2006;114(18):441. [Google Scholar]
- 76.Teerlink JR. A novel approach to improve cardiac performance: cardiac myosin activators. Heart Fail Rev. 2009;14(4):289–298. doi: 10.1007/s10741-009-9135-0. [DOI] [PMC free article] [PubMed] [Google Scholar]
- 77.Zewail AH. Four-dimensional electron microscopy. Science. 2010;238:187–193. doi: 10.1126/science.1166135. [DOI] [PubMed] [Google Scholar]
- 78.Flannigan DJ, Zewail AH. 4D electron microscopy: principles and applications. Acc Chem Res. 2012;45:1828–1839. doi: 10.1021/ar3001684. [DOI] [PubMed] [Google Scholar]
- 79.Lorenz UJ, Zewail AH. Biomechanics of DNA structures visualised by 4D electron microscopy. Proc Natl Acad Sci USA. 2013;110:2822–2827. doi: 10.1073/pnas.1300630110. [DOI] [PMC free article] [PubMed] [Google Scholar]
- 80.Harris SP, Lyons RG, Bezold KL. In the thick of it: HCM-causing mutations in myosin binding proteins of the thick filament. Circ Res. 2011;108(6):751–764. doi: 10.1161/CIRCRESAHA.110.231670. (url: http://www.ncbi.nlm.nih.gov/pubmed/21415409) [DOI] [PMC free article] [PubMed] [Google Scholar]


