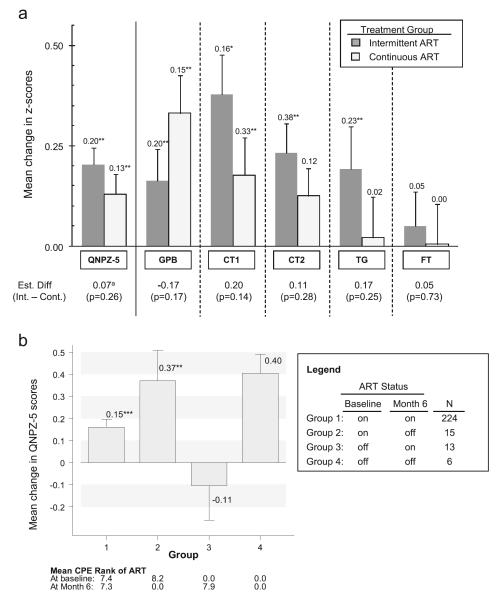
Fig. 2.
a Change in QNPZ-5 and z scores from baseline to month 6, with 1 SE indicated by error bars. b Change in QNPZ-5 scores within subgroups by ART status, and mean CPE rank of ART at baseline and month 6. *P≤0.05, increase in z score is statistically significant (for two-sided t test); **P<0.01; ***P<0.001. Superscript letter a estimated difference 0.05 (P=0.40) after adjustment for change in CD4 and HIV RNA. CPE Rank CNS penetration rank of ART (Letendre et al. 2010), CT Color Trails tests, FT Finger Tapping test (nondominant hand), GPB Grooved Pegboard (dominant hand), QNPZ-5 quantitative neurocognitive performance z score, TG Timed Gait test

