
Figure 1. Wall motion defects and evidence of ROS production after MI.
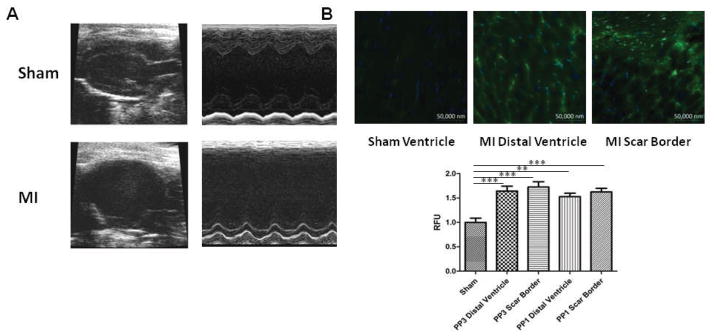
(A) Representative trichrome staining and echocardiography images of sham and MI mice, demonstrating scar formation and decreased anterior wall movement in the MI model. (B). Representative images of fluorescent nitrotyrosine stains indicative of increased ROS in the distal ventricle and scar border of PP3 and PP1-treated post-MI mice. Quantification of relative fluorescent units (RFUs) demonstrates significantly elevated ROS in the distal ventricle and scar border of both PP3 and PP1 groups compared to sham. There were no differences between treatment groups.