
Figure 2. c-Src inhibition with PP1 improves Cx43 levels after MI.
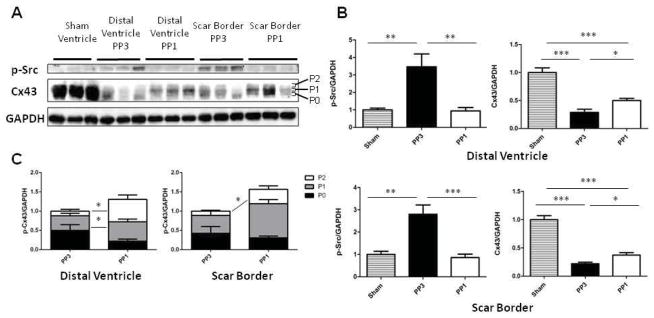
(A) Representative images of p-Src, Cx43, and GAPDH Western blots. Cx43 blots are subcategorized into P0, P1, or P2 bands reflecting increasing levels of phsophorylation. (B) Quantification of band intensity of p-Src and Cx43 normalized to GAPDH expression and relative to sham expression levels. (C) Distribution of Cx43 phosphorylation states according to treatment group.