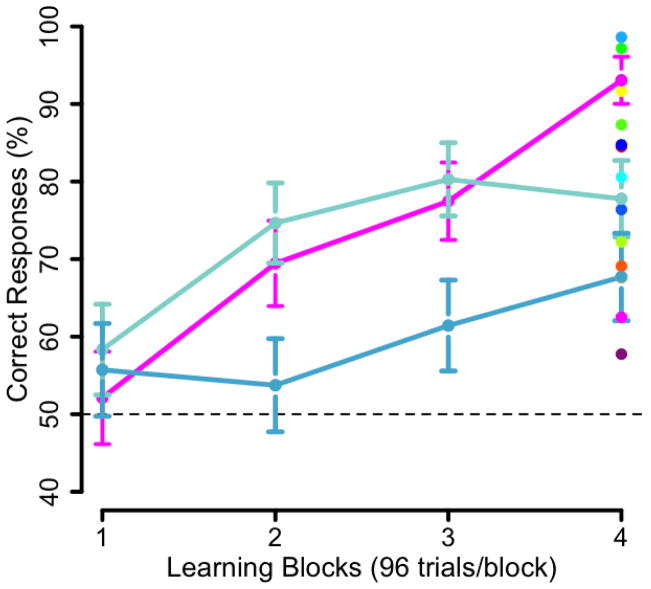
Figure 3.
Comparing learning outcomes (performance on the final block of a learning task) with overall learning trajectories in a replication of Shohamy and Wagner (2008). On the right of panel, dots represent individual performance on the final block of learning or learning outcomes for all participants’. The learning trajectories of three participants are presented. The two participants presented in blue have similar learning outcomes but divergent learning trajectories. The participants represented in dark blue and pink have very different learning outcomes despite having nearly identical learning trajectories for the first three blocks. Error bars represent the standard error of the mean.

