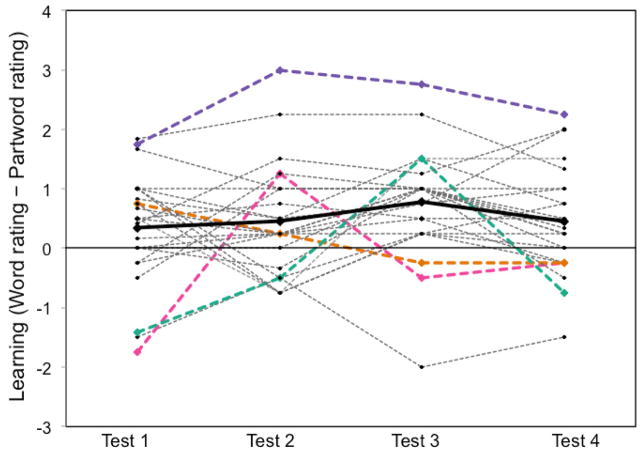
Figure 4.
Variability in individual learning trajectories (adapted from Karuza et al. (2013)). Data points plotted above were calculated as the word rating - partword rating (i.e., the extent of learning) for each test. A high score indicates that a participant was able to successfully discriminate words from partwords, whereas a score at or below zero indicates a failure to learn or to maintain previously acquired knowledge. A score below zero indicates that a participant rated partwords as more familiar than words. The bolded black line represents mean performance. Selected individual participants are presented in color to allow for examination of their individual trajectories.

