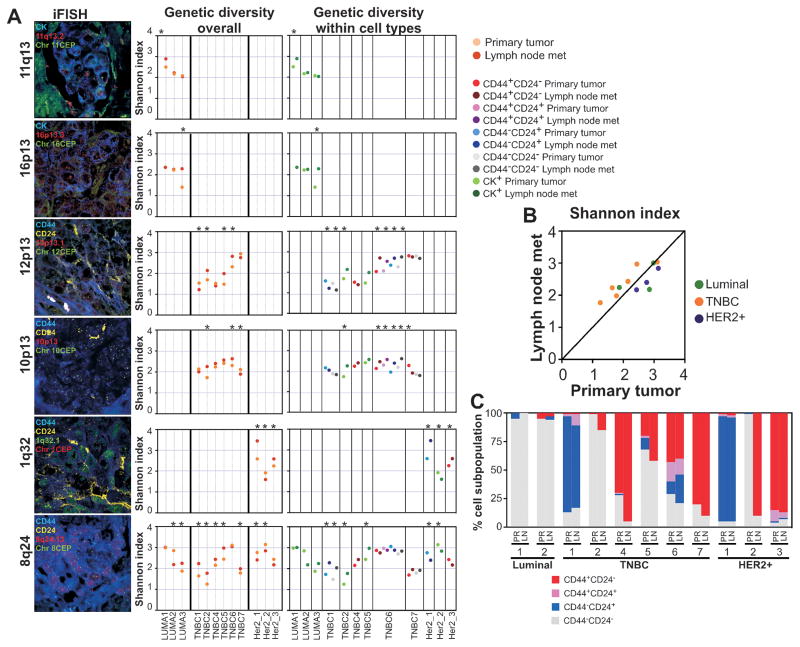
Figure 2. Genetic diversity of matched primary tumors and lymph node metastases.
A, representative images of iFISH for the indicated probes and markers. Dot plots depict Shannon diversity indices calculated based on unique BAC and CEP counts in all cancer cells combined (overall) and in phenotypically distinct tumor cell subpopulations. Dots represent primary tumors and lymph node metastases or phenotypically distinct tumor cell subpopulations within these lesions. Asterisks indicate significant (p<0.05, statistical methodology described in Supplementary methods online) differences. Details of tissue samples and Shannon index of diversity calculations are listed in Supplementary Tables S5–S6. B, Differences in Shannon diversity index between primary tumors and matched lymph node metastases according to breast tumor subtype. C, Bar graphs depict the relative frequencies of CD44+CD24−, CD44+CD24+, CD44−CD24+, and CD44−CD24− cells in matched primary tumors and lymph node metastases. TNBC - Triple Negative Breast Cancer.

