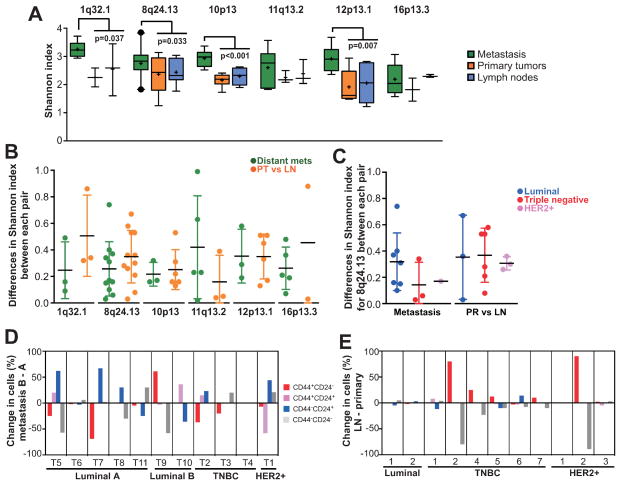
Figure 3. Differences in diversity between distant and lymph node metastases.
A, box plots depict Shannon diversity indices of primary tumors, and lymph node and distant metastases. Boxes show 25th to 75th percentile whereas whiskers extend to 5th and 95th percentiles. Outliers outside of 5th and 95th percentile are shown as black dots. Significant differences by Mann-Whitney test between two distant metastases within the same patient and primary and lymph node metastasis are shown. B, dot plots showing the differences in Shannon index between each pair of distant metastasis or between each pair of primary and lymph node metastasis for the indicated chromosomal regions. C, differences in Shannon index for 8q24.13 in each tumor subtype. Relative changes in the frequency of each of the indicated cell population is shown in metastases (D) and in matched primary tumors and lymph node metastases (E). Details of tissue samples are listed in Supplementary Table S1. PR - primary tumor, LN - lymph node metastasis, TNBC - Triple Negative Breast Cancer.

