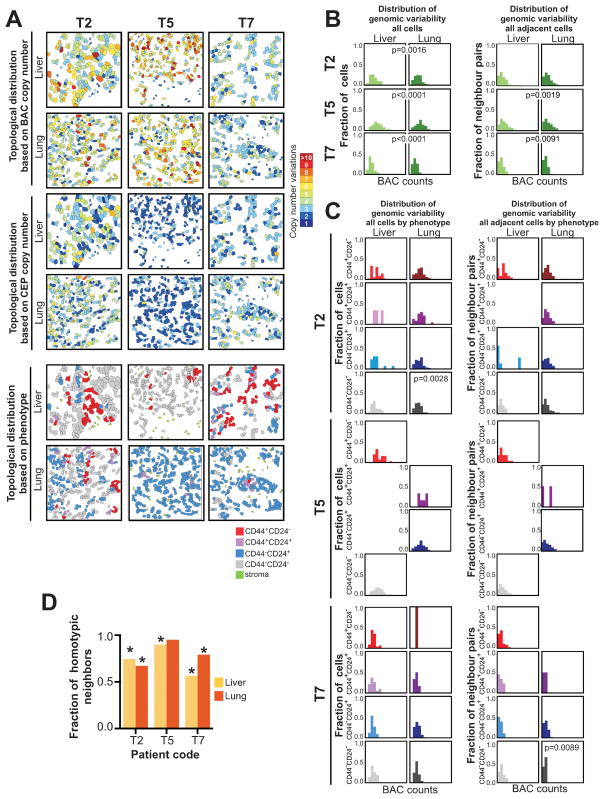
Figure 4. Analysis of tumor topology.
A, maps show topologic differences in the distribution of genetically distinct tumor cells based on copy number for 8q24 BAC, chromosome 8 CEP, and cellular phenotype in liver and lung metastases of three breast cancer patients. B, histograms depicting absolute differences in copy numbers for BAC probe counts regardless of cellular phenotype in all cells or in adjacent cells in liver and lung metastases. C, histograms depicting absolute differences in copy numbers for BAC probe counts in all cells of the same phenotype or in adjacent cells of the same phenotype in liver and lung metastases. D, fraction of adjacent cells with the same phenotype in liver and lung metastases. Significance of the differences was determined by calculating the homotypic fraction for 100,000 iterations of permutation testing over randomized cellular phenotypes; asterisks indicate significant (p<0.05) differences.

