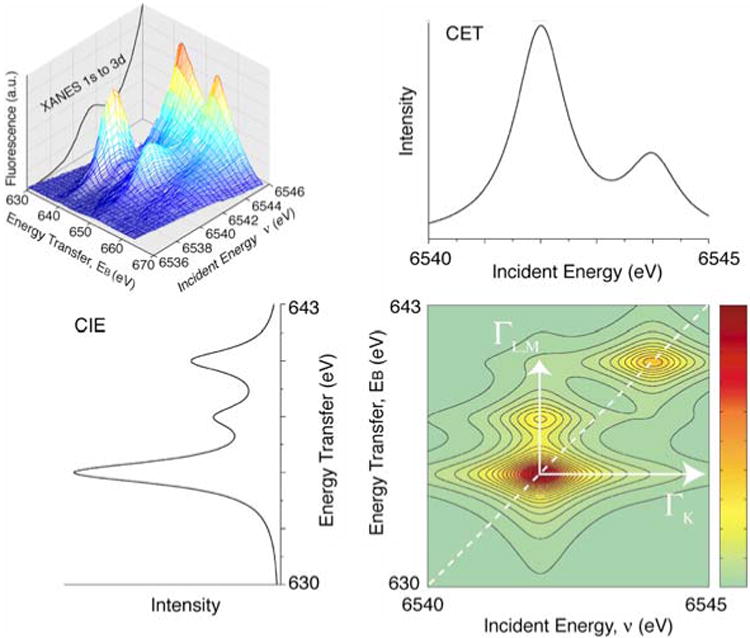
Fig. 10.

(Top left) A three-dimensional plot showing the theoretical resonant inelastic X-ray spectrum. Abscissa is the excitation energy across the 1s–3d energy range of the spectrum. The 1s–3d K-edge fluorescence excitation spectrum is plotted in the back of the three-dimensional spectrum for reference. Ordinate is the difference between the excitation and emission energy. (Bottom right) The RIXS landscape shown as a contour plot. An integration of the 2D plot parallel to the ordinate yields L-edge like spectra (left bottom), the more intense feature at 640 eV corresponds to transitions to J = 3/2 like states (L3 edges) and transitions to 655 eV correspond to J = 1/2 final states (L2 edges). Integrations parallel to the energy transfer axis sort the spectrum according to the final state (right top). The figure was adapted from Glatzel et al. (2004)
