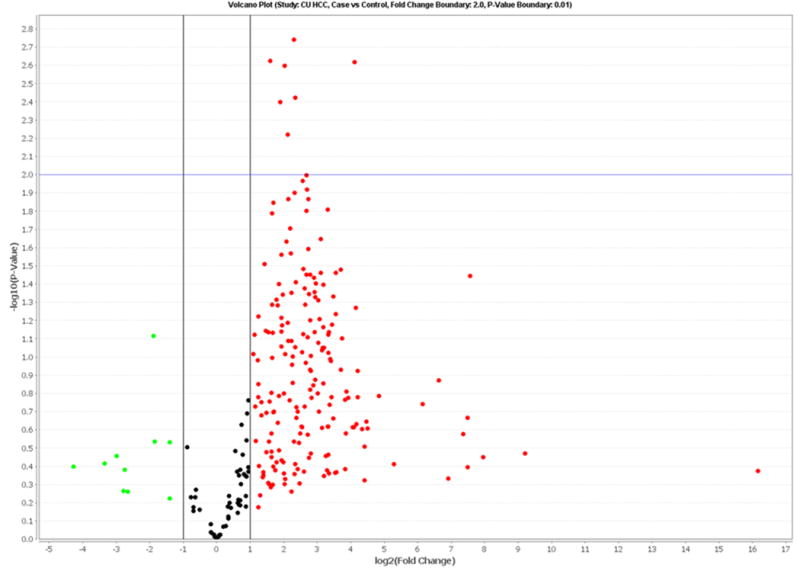
Figure 1.

Volcano plot of detectable genome-wide miRNA profiles in differentiating 20 HCC cases from age-, gender- and ethnicity-matched controls. The x-axis shows the log2 fold-change in circulating miRNAs' expression between HCC cases and controls, while the y-axis shows the −log10 of the adjusted p value for each miRNA, representing the strength of the association. Above the dashed line indicates statistically significant (p<0.01) after Bonferroni correction.
