
Figure 2.
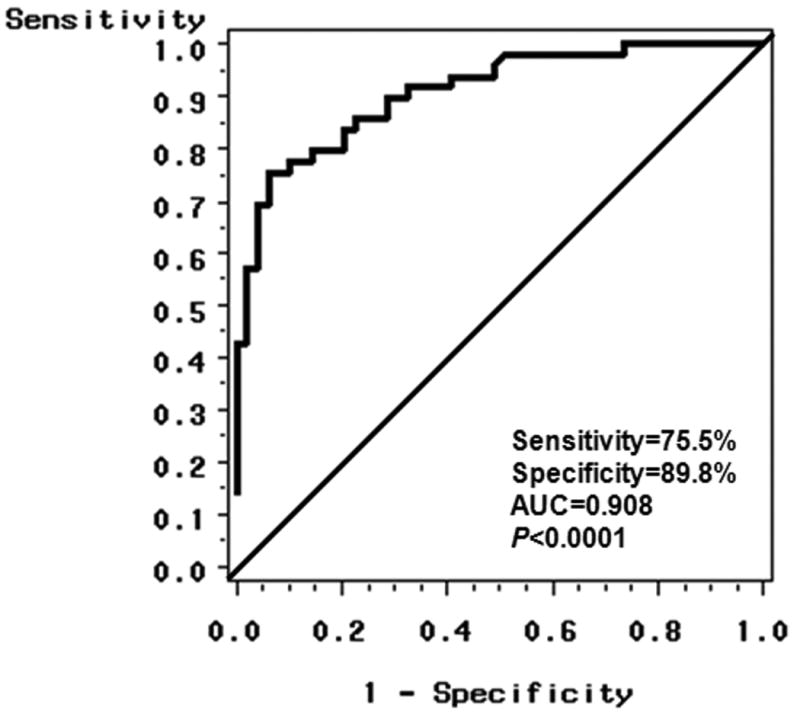
Receiver-operator characteristic (ROC) curve plot of sensitive vs. 1–specificity for miR-483-5p levels and HCV status that can differentiate HCC cases from controls. The area under the curve (AUC) is 0.908 (p<0.0001) for the probability cut-point of 0.50 with a sensitivity of 75.5% (37/49) and a specificity of 89.8% (44/49).