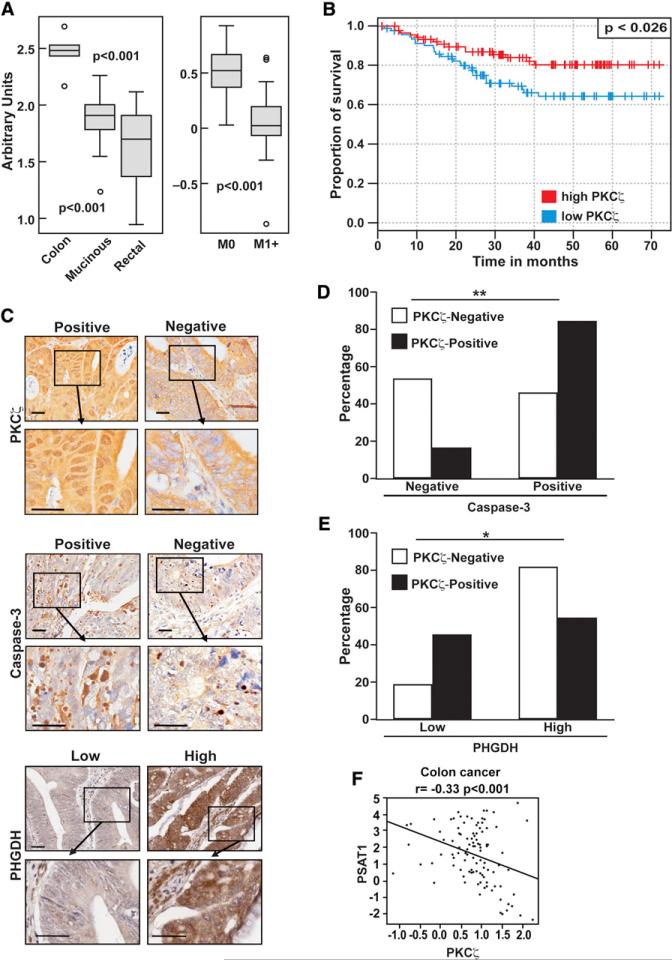
Figure 7. Tumor Suppressor Role of PKCζ in Human Colon Cancer.
(A) Gene expression analysis of PKCζ in human colon cancer samples in public microarray data.
(B) Kaplan-Meier curves comparing the survival of patients with high versus low expression of PKCζ.
(C) Representative sections of PKCζ, caspase-3, and PHGDH immunostaining. Scale bars, 50 μm.
(D) Associated correlation of caspase-3 and PKCζ expression in human colon cancer TMA. Nuclear PKCζ expression positively correlates with active caspase-3 levels. **p < 0.01.
(E) Associated correlation of PHGDH and PKCζ expression in human colon cancer TMA. Nuclear PKCζ expression negatively correlates with PHGDH levels. *p < 0.05.
(F) Negative correlation between PKCζ and PSAT1 mRNA levels in human colorectal carcinomas.

