
Figure 7. Numb expression correlates with glioblastoma subclass and patient survival.
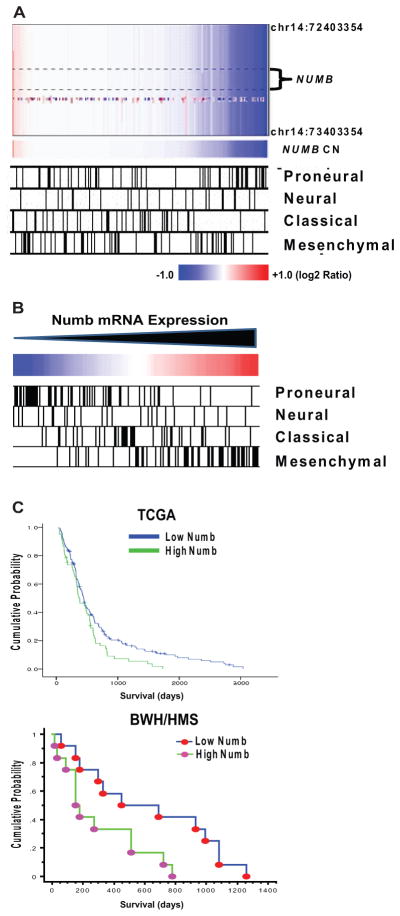
(A): TCGA array CGH data from 197 glioblastomas illustrating relationship between NUMB copy number and glioblastoma subclass. Subclass designations for TCGA glioblastoma specimens are from [33]. (B): mRNA expression data from 197 glioblastomas illustrating relationship between Numb expression and glioblastoma subclass. Subclass designations for tumor specimens are the same as in (A). (C): (upper panel) Cox regression analysis of Numb mRNA and survival for 197 glioblastoma patients (data from TCGA for glioblastoma). p = .024, log-rank test. (lower panel) Kaplan–Meier analysis of Numb mRNA and survival in 24 glioblastoma specimens from our institution (BWH/HMS). Specimens were divided into two equal groups based upon Numb mRNA expression. p = .021, log-rank test. Abbreviation: TCGA, The Cancer Genome Atlas.