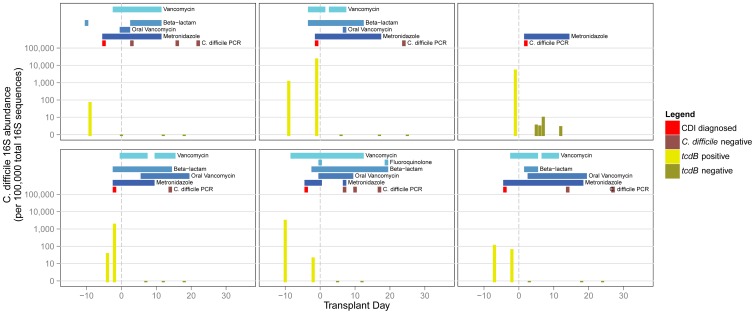
Figure 3. Intestinal composition of C. difficile in six selected cases of CDI.
Observed abundance of C. difficile 16S is shown for each fecal specimen in the bargraph over the course of transplantation. The corresponding timing of CDI and antibiotic administration is shown at the top of each plot. Plots of all 94 patients in the biospecimen group can be found in Figure S1.

