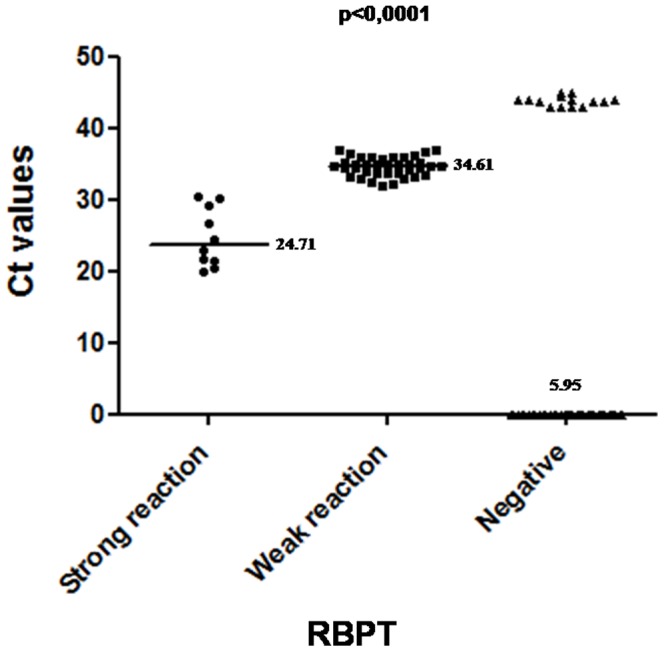
Figure 1. Correlation between real-time PCR and the RBPT results.

The mean Ct-value of samples negative for Brucella (5.95) was significantly lower than that of samples with a strong reaction results (24.71), which is lower than that of samples with a weak reaction (34.61) (p<0,0001).
