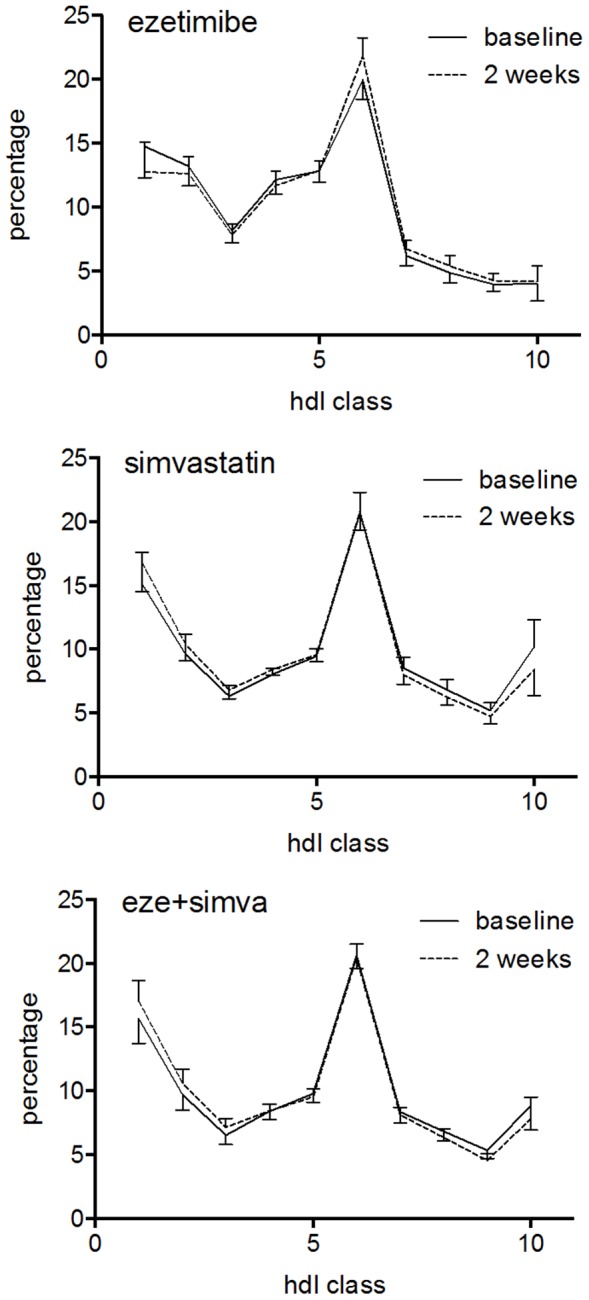
Figure 2. HDL subclass distribution before (solid line) and after 2 weeks of treatment (dotted lines).

The data are means (95% confidence intervals) of the percentage of total HDL cholesterol. (A) ezetimibe, (B) simvastatin, (C) ezetimibe plus simvastatin.
