
Figure 1. GPCR expression in TG1, OB1, f-NSC, HA and U-87 -MG cells.
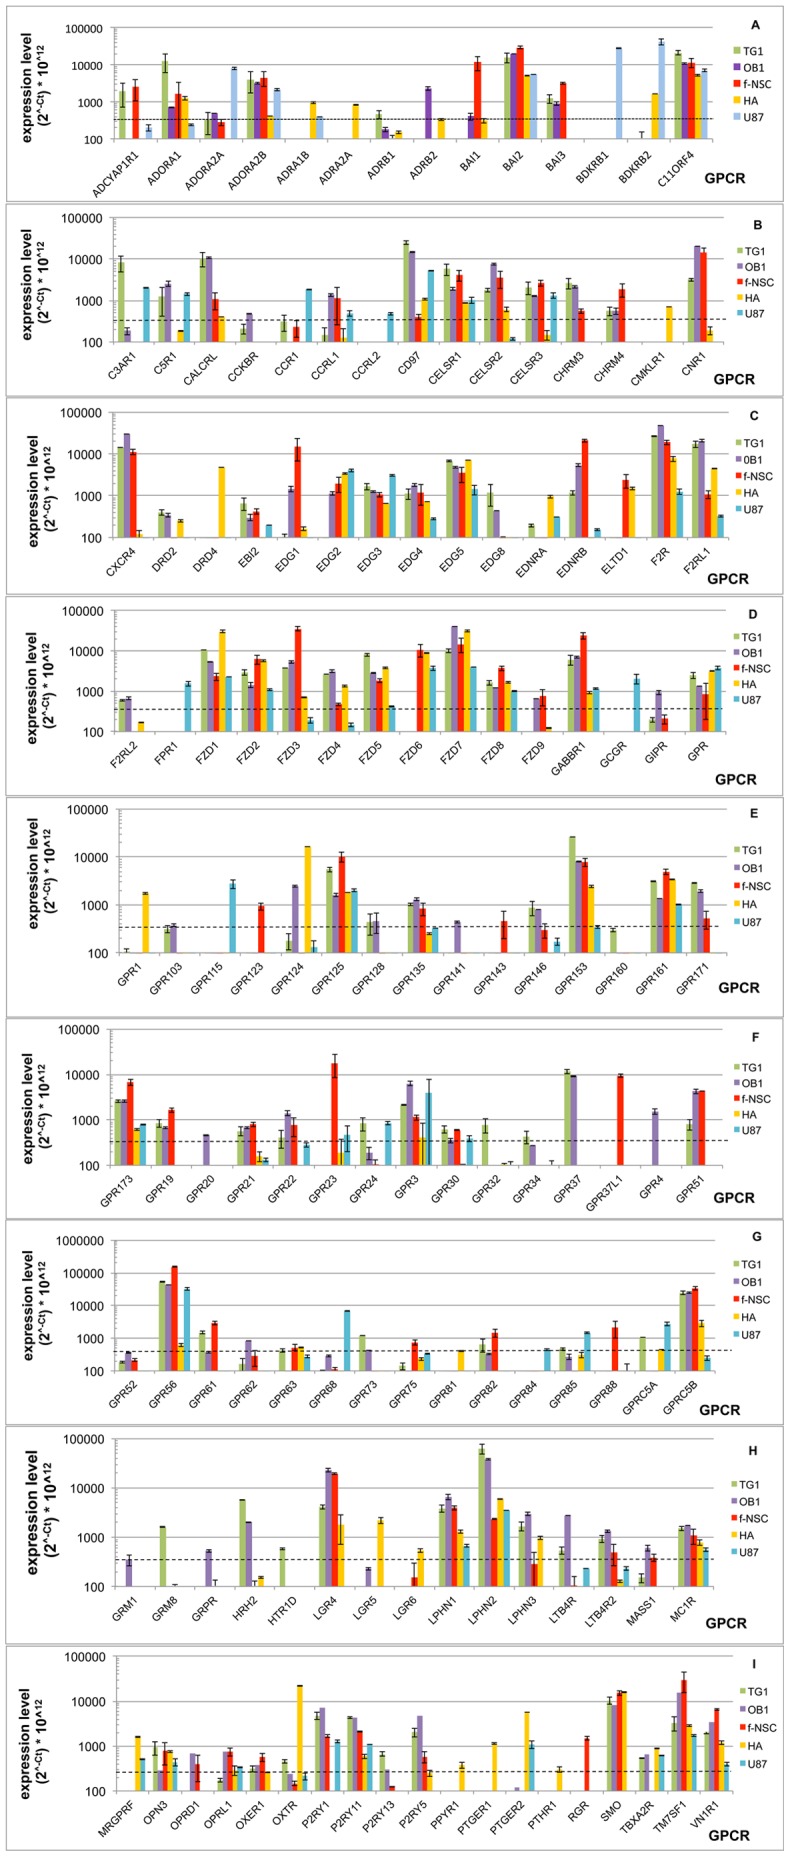
GPCR expression was determined by RT-QPCR. GPCRs are presented in alphabetical order. Expression levels are related to the cycle threshold value and expressed as 2∧−Ct * 10∧12, where Ct corresponds to the cycle threshold of a given GPCR. A Ct of 31.5 corresponds to an expression level of 329 (arbitrary units). Dotted lines indicate the cutoff level (Ct = 31.5). Expression levels are presented on a logarithmic scale. All data were normalized using RPLP0 as housekeeping gene.