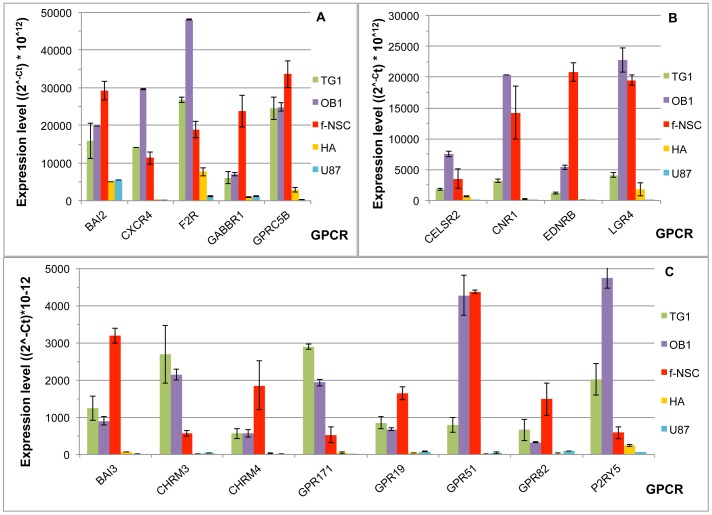
Figure 5. GPCRs overexpressed in the GSCs TG1 and OB1 and the fetal neural stem cells (f-NSCs).
The ordinate represents the expression level of the different GPCRs shown as (2∧−Ct * 10∧12) where Ct corresponds to the cycle threshold of a given GPCR. Note the difference in scale between A, B and C. HA corresponds to human astrocytes and U-87 to the GBM cell line U-87 MG.

